J. Todd Hoeksema
Large-Scale Spatial Cross-Calibration of Hinode/SOT-SP and SDO/HMI
Sep 29, 2022


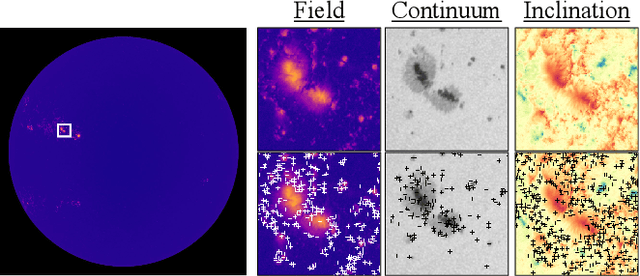
Abstract:We investigate the cross-calibration of the Hinode/SOT-SP and SDO/HMI instrument meta-data, specifically the correspondence of the scaling and pointing information. Accurate calibration of these datasets gives the correspondence needed by inter-instrument studies and learning-based magnetogram systems, and is required for physically-meaningful photospheric magnetic field vectors. We approach the problem by robustly fitting geometric models on correspondences between images from each instrument's pipeline. This technique is common in computer vision, but several critical details are required when using scanning slit spectrograph data like Hinode/SOT-SP. We apply this technique to data spanning a decade of the Hinode mission. Our results suggest corrections to the published Level 2 Hinode/SOT-SP data. First, an analysis on approximately 2,700 scans suggests that the reported pixel size in Hinode/SOT-SP Level 2 data is incorrect by around 1%. Second, analysis of over 12,000 scans show that the pointing information is often incorrect by dozens of arcseconds with a strong bias. Regression of these corrections indicates that thermal effects have caused secular and cyclic drift in Hinode/SOT-SP pointing data over its mission. We offer two solutions. First, direct co-alignment with SDO/HMI data via our procedure can improve alignments for many Hinode/SOT-SP scans. Second, since the pointing errors are predictable, simple post-hoc corrections can substantially improve the pointing. We conclude by illustrating the impact of this updated calibration on derived physical data products needed for research and interpretation. Among other things, our results suggest that the pointing errors induce a hemispheric bias in estimates of radial current density.
SynthIA: A Synthetic Inversion Approximation for the Stokes Vector Fusing SDO and Hinode into a Virtual Observatory
Aug 27, 2021


Abstract:Both NASA's Solar Dynamics Observatory (SDO) and the JAXA/NASA Hinode mission include spectropolarimetric instruments designed to measure the photospheric magnetic field. SDO's Helioseismic and Magnetic Imager (HMI) emphasizes full-disk high-cadence and good spatial resolution data acquisition while Hinode's Solar Optical Telescope Spectro-Polarimeter (SOT-SP) focuses on high spatial resolution and spectral sampling at the cost of a limited field of view and slower temporal cadence. This work introduces a deep-learning system named SynthIA (Synthetic Inversion Approximation), that can enhance both missions by capturing the best of each instrument's characteristics. We use SynthIA to produce a new magnetogram data product, SynodeP (Synthetic Hinode Pipeline), that mimics magnetograms from the higher spectral resolution Hinode/SOT-SP pipeline, but is derived from full-disk, high-cadence, and lower spectral-resolution SDO/HMI Stokes observations. Results on held-out data show that SynodeP has good agreement with the Hinode/SOT-SP pipeline inversions, including magnetic fill fraction, which is not provided by the current SDO/HMI pipeline. SynodeP further shows a reduction in the magnitude of the 24-hour oscillations present in the SDO/HMI data. To demonstrate SynthIA's generality, we show the use of SDO/AIA data and subsets of the HMI data as inputs, which enables trade-offs between fidelity to the Hinode/SOT-SP inversions, number of observations used, and temporal artifacts. We discuss possible generalizations of SynthIA and its implications for space weather modeling. This work is part of the NASA Heliophysics DRIVE Science Center (SOLSTICE) at the University of Michigan under grant NASA 80NSSC20K0600E, and will be open-sourced.
Flare Prediction Using Photospheric and Coronal Image Data
Aug 03, 2017


Abstract:The precise physical process that triggers solar flares is not currently understood. Here we attempt to capture the signature of this mechanism in solar image data of various wavelengths and use these signatures to predict flaring activity. We do this by developing an algorithm that [1] automatically generates features in 5.5 TB of image data taken by the Solar Dynamics Observatory of the solar photosphere, chromosphere, transition region, and corona during the time period between May 2010 and May 2014, [2] combines these features with other features based on flaring history and a physical understanding of putative flaring processes, and [3] classifies these features to predict whether a solar active region will flare within a time period of $T$ hours, where $T$ = 2 and 24. We find that when optimizing for the True Skill Score (TSS), photospheric vector magnetic field data combined with flaring history yields the best performance, and when optimizing for the area under the precision-recall curve, all the data are helpful. Our model performance yields a TSS of $0.84 \pm 0.03$ and $0.81 \pm 0.03$ in the $T$ = 2 and 24 hour cases, respectively, and a value of $0.13 \pm 0.07$ and $0.43 \pm 0.08$ for the area under the precision-recall curve in the $T$ = 2 and 24 hour cases, respectively. These relatively high scores are similar to, but not greater than, other attempts to predict solar flares. Given the similar values of algorithm performance across various types of models reported in the literature, we conclude that we can expect a certain baseline predictive capacity using these data. This is the first attempt to predict solar flares using photospheric vector magnetic field data as well as multiple wavelengths of image data from the chromosphere, transition region, and corona.
 Add to Chrome
 Add to Firefox
 Add to Edge