Irene Epifanio
Incorporating Fairness Constraints into Archetypal Analysis
Jul 16, 2025Abstract:Archetypal Analysis (AA) is an unsupervised learning method that represents data as convex combinations of extreme patterns called archetypes. While AA provides interpretable and low-dimensional representations, it can inadvertently encode sensitive attributes, leading to fairness concerns. In this work, we propose Fair Archetypal Analysis (FairAA), a modified formulation that explicitly reduces the influence of sensitive group information in the learned projections. We also introduce FairKernelAA, a nonlinear extension that addresses fairness in more complex data distributions. Our approach incorporates a fairness regularization term while preserving the structure and interpretability of the archetypes. We evaluate FairAA and FairKernelAA on synthetic datasets, including linear, nonlinear, and multi-group scenarios, demonstrating their ability to reduce group separability -- as measured by mean maximum discrepancy and linear separability -- without substantially compromising explained variance. We further validate our methods on the real-world ANSUR I dataset, confirming their robustness and practical utility. The results show that FairAA achieves a favorable trade-off between utility and fairness, making it a promising tool for responsible representation learning in sensitive applications.
A Survey on Archetypal Analysis
Apr 16, 2025Abstract:Archetypal analysis (AA) was originally proposed in 1994 by Adele Cutler and Leo Breiman as a computational procedure to extract the distinct aspects called archetypes in observations with each observational record approximated as a mixture (i.e., convex combination) of these archetypes. AA thereby provides straightforward, interpretable, and explainable representations for feature extraction and dimensionality reduction, facilitating the understanding of the structure of high-dimensional data with wide applications throughout the sciences. However, AA also faces challenges, particularly as the associated optimization problem is non-convex. This survey provides researchers and data mining practitioners an overview of methodologies and opportunities that AA has to offer surveying the many applications of AA across disparate fields of science, as well as best practices for modeling data using AA and limitations. The survey concludes by explaining important future research directions concerning AA.
Biarchetype analysis: simultaneous learning of observations and features based on extremes
Nov 18, 2023Abstract:A new exploratory technique called biarchetype analysis is defined. We extend archetype analysis to find the archetypes of both observations and features simultaneously. The idea of this new unsupervised machine learning tool is to represent observations and features by instances of pure types (biarchetypes) that can be easily interpreted as they are mixtures of observations and features. Furthermore, the observations and features are expressed as mixtures of the biarchetypes, which also helps understand the structure of the data. We propose an algorithm to solve biarchetype analysis. We show that biarchetype analysis offers advantages over biclustering, especially in terms of interpretability. This is because byarchetypes are extreme instances as opposed to the centroids returned by biclustering, which favors human understanding. Biarchetype analysis is applied to several machine learning problems to illustrate its usefulness.
Ordinal classification for interval-valued data and interval-valued functional data
Oct 30, 2023Abstract:The aim of ordinal classification is to predict the ordered labels of the output from a set of observed inputs. Interval-valued data refers to data in the form of intervals. For the first time, interval-valued data and interval-valued functional data are considered as inputs in an ordinal classification problem. Six ordinal classifiers for interval data and interval-valued functional data are proposed. Three of them are parametric, one of them is based on ordinal binary decompositions and the other two are based on ordered logistic regression. The other three methods are based on the use of distances between interval data and kernels on interval data. One of the methods uses the weighted $k$-nearest-neighbor technique for ordinal classification. Another method considers kernel principal component analysis plus an ordinal classifier. And the sixth method, which is the method that performs best, uses a kernel-induced ordinal random forest. They are compared with na\"ive approaches in an extensive experimental study with synthetic and original real data sets, about human global development, and weather data. The results show that considering ordering and interval-valued information improves the accuracy. The source code and data sets are available at https://github.com/aleixalcacer/OCFIVD.
Finding archetypal patterns for binary questionnaires
Feb 28, 2020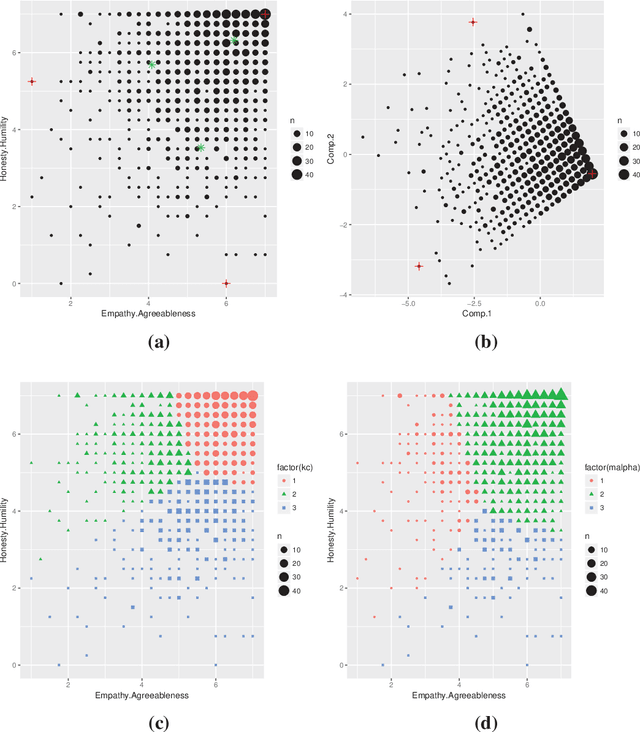
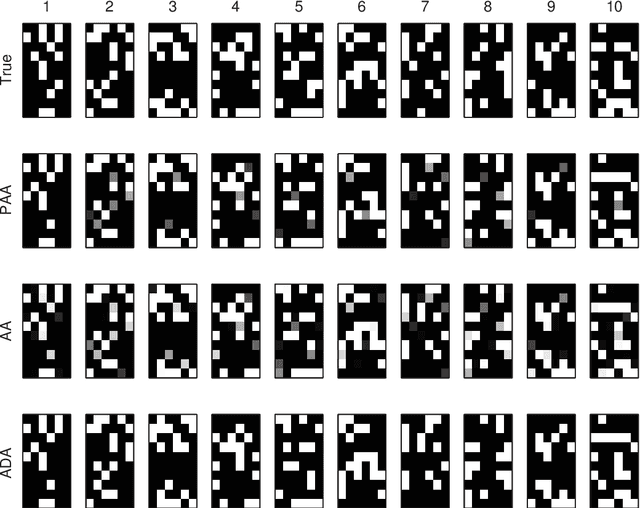

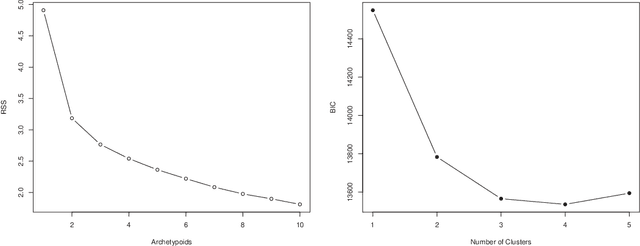
Abstract:Archetypal analysis is an exploratory tool that explains a set of observations as mixtures of pure (extreme) patterns. If the patterns are actual observations of the sample, we refer to them as archetypoids. For the first time, we propose to use archetypoid analysis for binary observations. This tool can contribute to the understanding of a binary data set, as in the multivariate case. We illustrate the advantages of the proposed methodology in a simulation study and two applications, one exploring objects (rows) and the other exploring items (columns). One is related to determining student skill set profiles and the other to describing item response functions.
Robust multivariate and functional archetypal analysis with application to financial time series analysis
Oct 01, 2018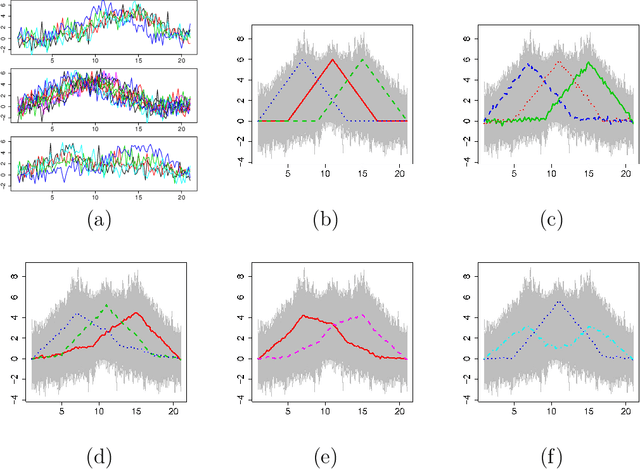

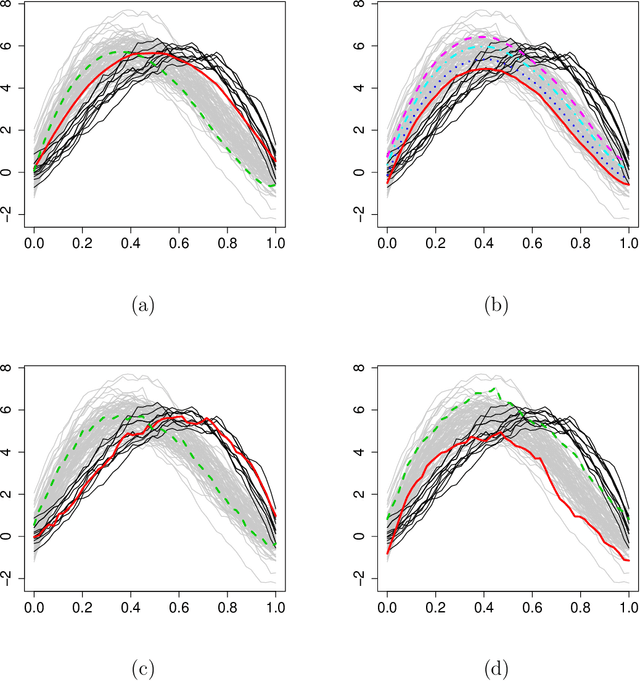
Abstract:Archetypal analysis approximates data by means of mixtures of actual extreme cases (archetypoids) or archetypes, which are a convex combination of cases in the data set. Archetypes lie on the boundary of the convex hull. This makes the analysis very sensitive to outliers. A robust methodology by means of M-estimators for classical multivariate and functional data is proposed. This unsupervised methodology allows complex data to be understood even by non-experts. The performance of the new procedure is assessed in a simulation study, where a comparison with a previous methodology for the multivariate case is also carried out, and our proposal obtains favorable results. Finally, robust bivariate functional archetypoid analysis is applied to a set of companies in the S\&P 500 described by two time series of stock quotes. A new graphic representation is also proposed to visualize the results. The analysis shows how the information can be easily interpreted and how even non-experts can gain a qualitative understanding of the data.
Functional archetype and archetypoid analysis
Jun 25, 2016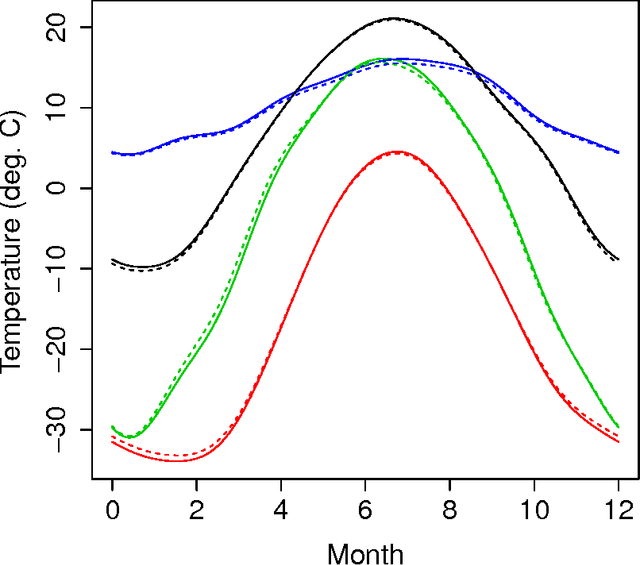

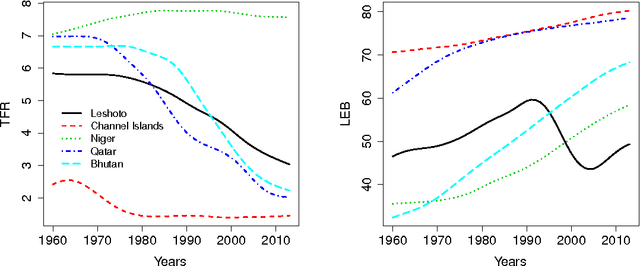
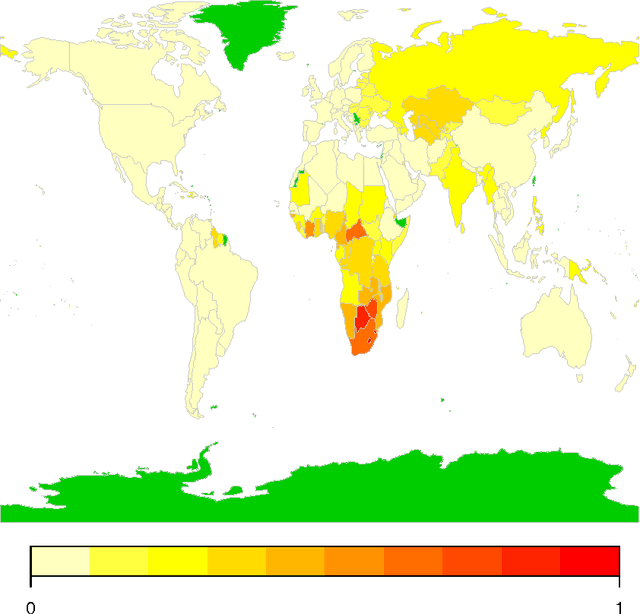
Abstract:Archetype and archetypoid analysis can be extended to functional data. Each function is represented as a mixture of actual observations (functional archetypoids) or functional archetypes, which are a mixture of observations in the data set. Well-known Canadian temperature data are used to illustrate the analysis developed. Computational methods are proposed for performing these analyses, based on the coefficients of a basis. Unlike a previous attempt to compute functional archetypes, which was only valid for an orthogonal basis, the proposed methodology can be used for any basis. It is computationally less demanding than the simple approach of discretizing the functions. Multivariate functional archetype and archetypoid analysis are also introduced and applied in an interesting problem about the study of human development around the world over the last 50 years. These tools can contribute to the understanding of a functional data set, as in the multivariate case.
 Add to Chrome
 Add to Firefox
 Add to Edge