Fankun Bu
A Two-layer Approach for Estimating Behind-the-Meter PV Generation Using Smart Meter Data
Oct 31, 2021

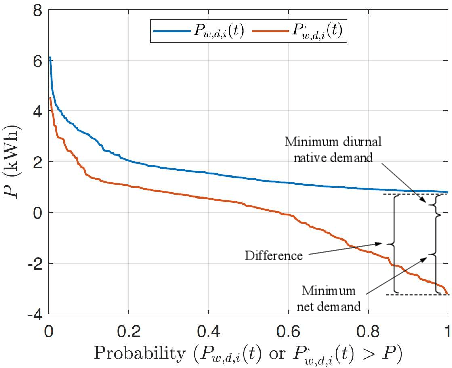
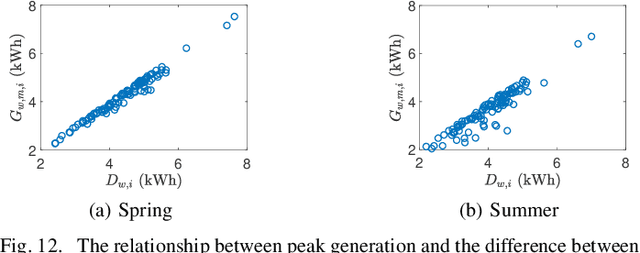
Abstract:As the cost of the residential solar system decreases, rooftop photovoltaic (PV) has been widely integrated into distribution systems. Most rooftop PV systems are installed behind-the-meter (BTM), i.e., only the net demand is metered, while the native demand and PV generation are not separately recorded. Under this condition, the PV generation and native demand are invisible to utilities, which brings challenges for optimal distribution system operation and expansion. In this paper, we have come up with a novel two-layer approach to disaggregate the unknown PV generation and native demand from the known hourly net demand data recorded by smart meters: 1) At the aggregate level, the proposed approach separates the total PV generation and native demand time series from the total net demand time series for customers with PVs. 2) At the customer level, the separated aggregate-level PV generation is allocated to individual PVs. These two layers leverage the spatial correlations of native demand and PV generation, respectively. One primary advantage of our proposed approach is that it is more independent and practical compared to previous works because it does not require PV array parameters, meteorological data and previously recorded solar power exemplars. We have verified our proposed approach using real native demand and PV generation data.
A Hierarchical Deep Actor-Critic Learning Method for Joint Distribution System State Estimation
Dec 04, 2020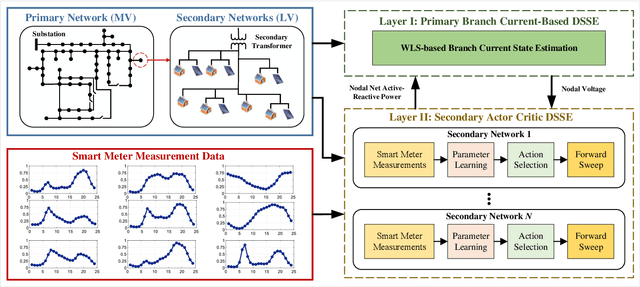
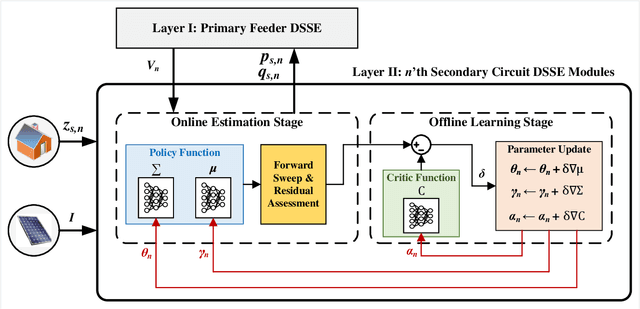
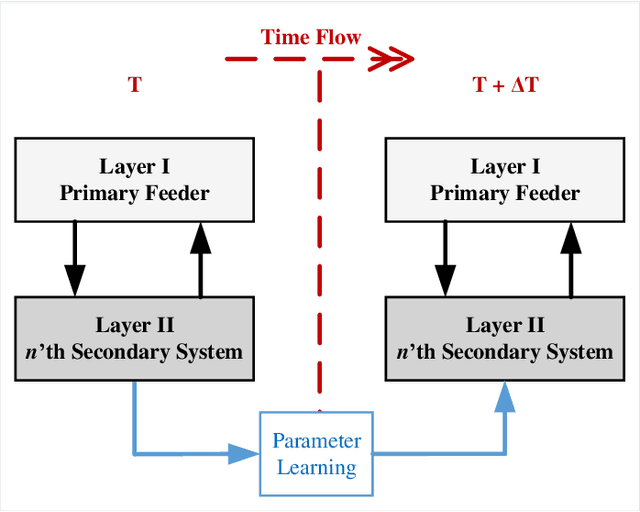

Abstract:Due to increasing penetration of volatile distributed photovoltaic (PV) resources, real-time monitoring of customers at the grid-edge has become a critical task. However, this requires solving the distribution system state estimation (DSSE) jointly for both primary and secondary levels of distribution grids, which is computationally complex and lacks scalability to large systems. To achieve near real-time solutions for DSSE, we present a novel hierarchical reinforcement learning-aided framework: at the first layer, a weighted least squares (WLS) algorithm solves the DSSE over primary medium-voltage feeders; at the second layer, deep actor-critic (A-C) modules are trained for each secondary transformer using measurement residuals to estimate the states of low-voltage circuits and capture the impact of PVs at the grid-edge. While the A-C parameter learning process takes place offline, the trained A-C modules are deployed online for fast secondary grid state estimation; this is the key factor in scalability and computational efficiency of the framework. To maintain monitoring accuracy, the two levels exchange boundary information with each other at the secondary nodes, including transformer voltages (first layer to second layer) and active/reactive total power injection (second layer to first layer). This interactive information passing strategy results in a closed-loop structure that is able to track optimal solutions at both layers in few iterations. Moreover, our model can handle the topology changes using the Jacobian matrices of the first layer. We have performed numerical experiments using real utility data and feeder models to verify the performance of the proposed framework.
Multi-Source Data-Driven Outage Location in Distribution Systems Using Probabilistic Graph Learning
Dec 04, 2020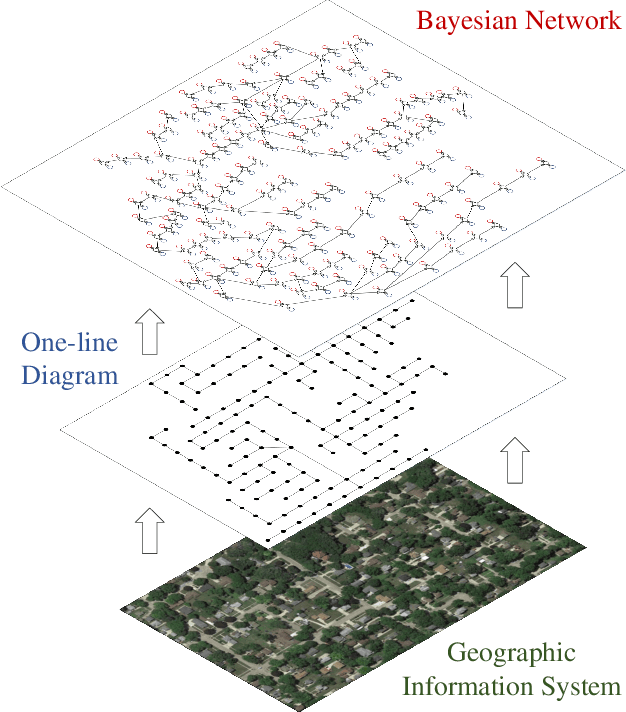
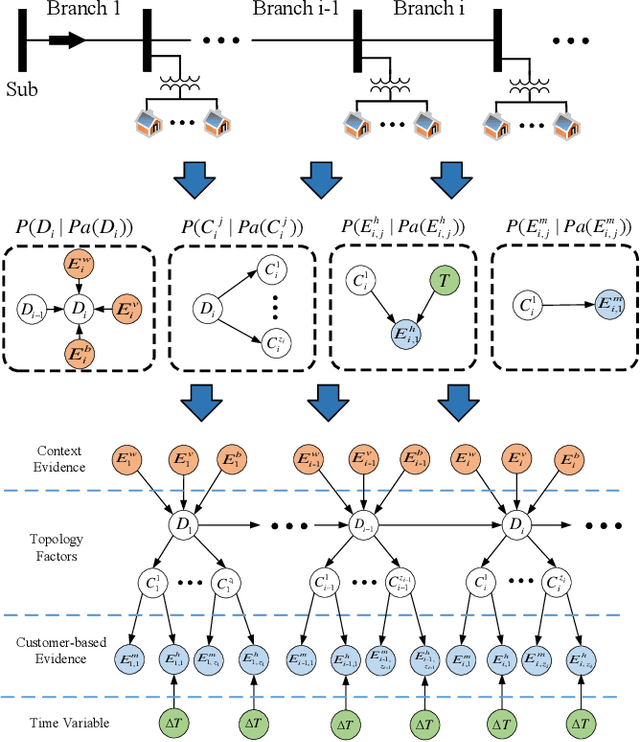
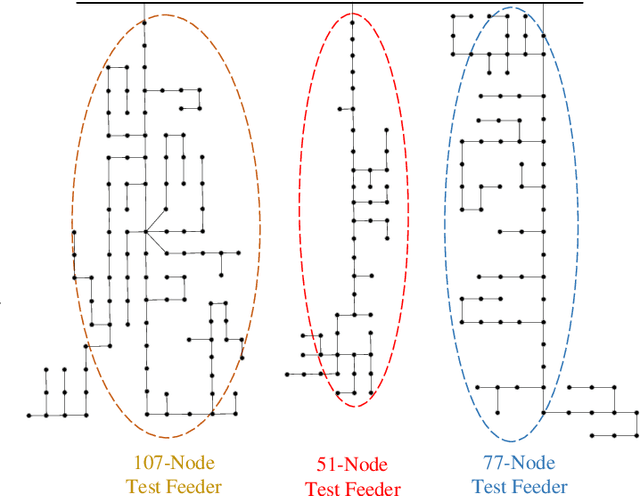
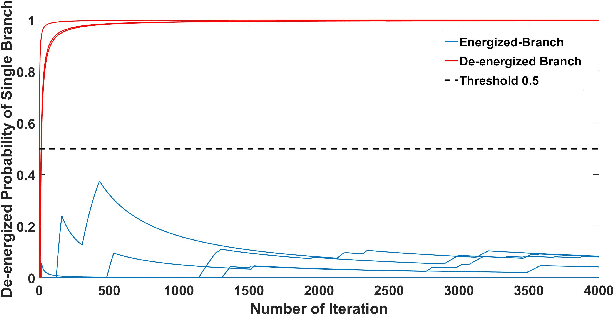
Abstract:Efficient outage location is critical to enhancing the resilience of power systems. However, accurate outage location requires combining massive evidence received from diverse data sources, including smart meter (SM) signals, customer trouble calls, social media messages, weather data, vegetation information, and physical parameters of the network. This is a computationally complex task due to the high dimensionality of data in distribution grids. In this paper, we propose a multi-source data fusion approach to locate outage events in partially observable distribution systems using Bayesian networks (BNs). A novel aspect of the proposed approach is that it takes multi-source evidence and the complex structure of distribution systems into account using a probabilistic graphical method. This method can radically reduce the computational complexity of outage location inference in high-dimensional spaces. The graphical structure of the proposed BN is established based on the grid's topology and the causal relationship between random variables, such as the states of branches/customers and evidence. Utilizing this graphical model, the locations of outages are obtained by leveraging a Gibbs sampling (GS) method, to infer the probabilities of de-energization for all branches. Compared with commonly-used exact inference methods that have exponential complexity in the size of the BN, GS quantifies the target conditional probability distributions in a timely manner. A case study of several real partially observable systems is presented to validate the method.
 Add to Chrome
 Add to Firefox
 Add to Edge