Faezeh Azizi
Russia-Ukraine war: Modeling and Clustering the Sentiments Trends of Various Countries
Jan 02, 2023
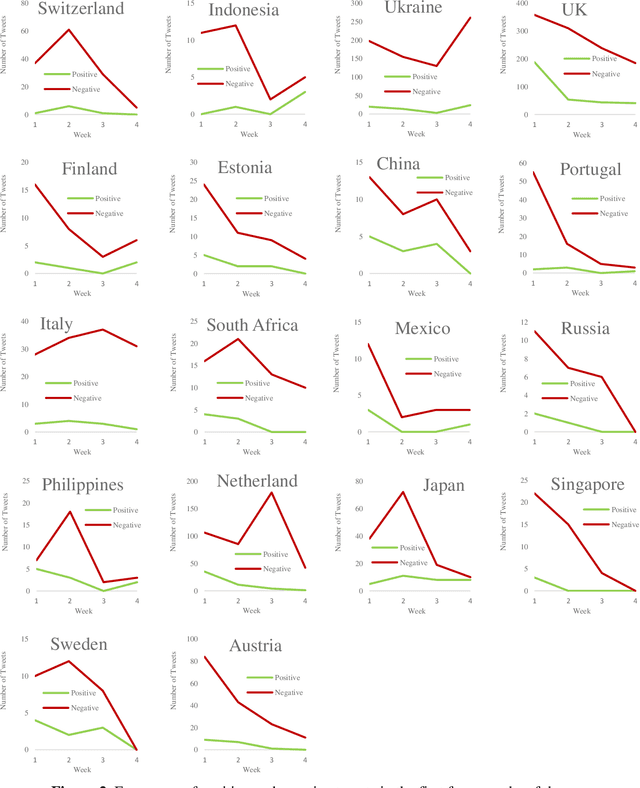
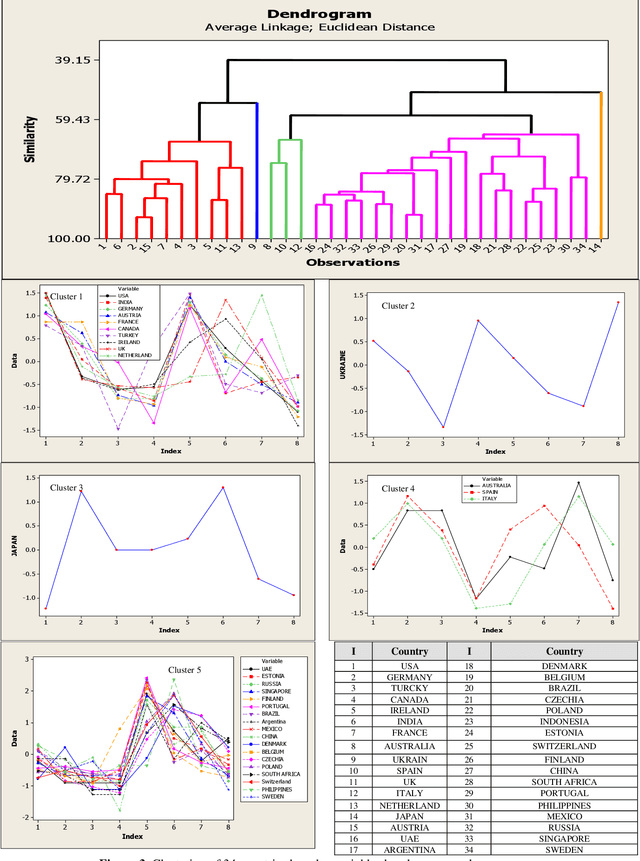
Abstract:With Twitter's growth and popularity, a huge number of views are shared by users on various topics, making this platform a valuable information source on various political, social, and economic issues. This paper investigates English tweets on the Russia-Ukraine war to analyze trends reflecting users' opinions and sentiments regarding the conflict. The tweets' positive and negative sentiments are analyzed using a BERT-based model, and the time series associated with the frequency of positive and negative tweets for various countries is calculated. Then, we propose a method based on the neighborhood average for modeling and clustering the time series of countries. The clustering results provide valuable insight into public opinion regarding this conflict. Among other things, we can mention the similar thoughts of users from the United States, Canada, the United Kingdom, and most Western European countries versus the shared views of Eastern European, Scandinavian, Asian, and South American nations toward the conflict.
Extracting Feelings of People Regarding COVID-19 by Social Network Mining
Oct 12, 2021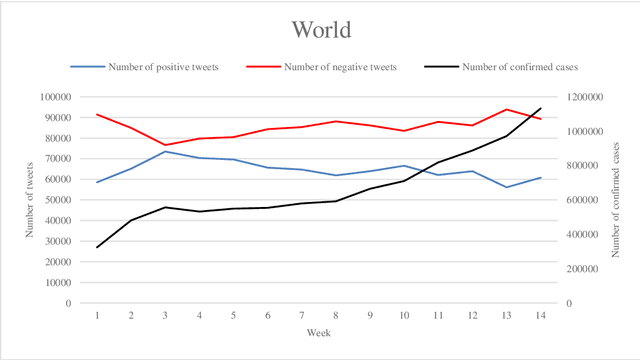
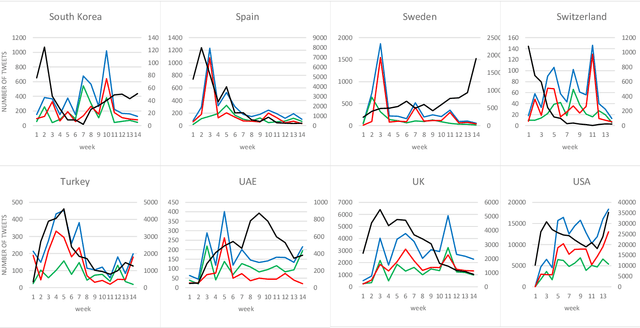
Abstract:In 2020, COVID-19 became the chief concern of the world and is still reflected widely in all social networks. Each day, users post millions of tweets and comments on this subject, which contain significant implicit information about the public opinion. In this regard, a dataset of COVID-related tweets in English language is collected, which consists of more than two million tweets from March 23 to June 23 of 2020 to extract the feelings of the people in various countries in the early stages of this outbreak. To this end, first, we use a lexicon-based approach in conjunction with the GeoNames geographic database to label the tweets with their locations. Next, a method based on the recently introduced and widely cited RoBERTa model is proposed to analyze their sentimental content. After that, the trend graphs of the frequency of tweets as well as sentiments are produced for the world and the nations that were more engaged with COVID-19. Graph analysis shows that the frequency graphs of the tweets for the majority of nations are significantly correlated with the official statistics of the daily afflicted in them. Moreover, several implicit knowledge is extracted and discussed.
Extracting Major Topics of COVID-19 Related Tweets
Oct 05, 2021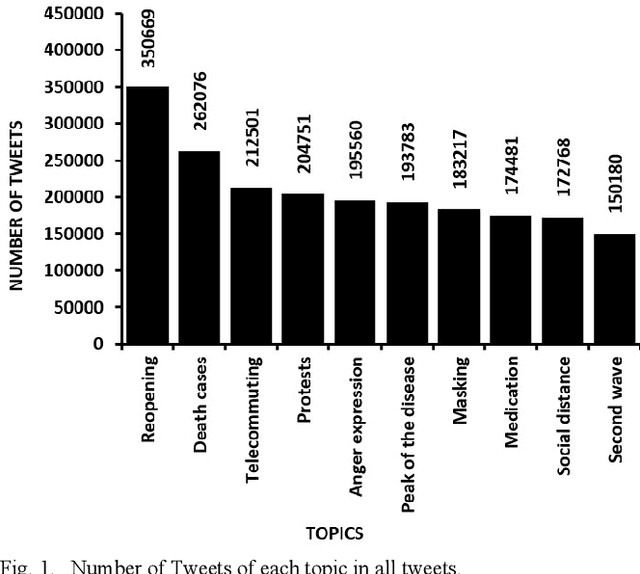

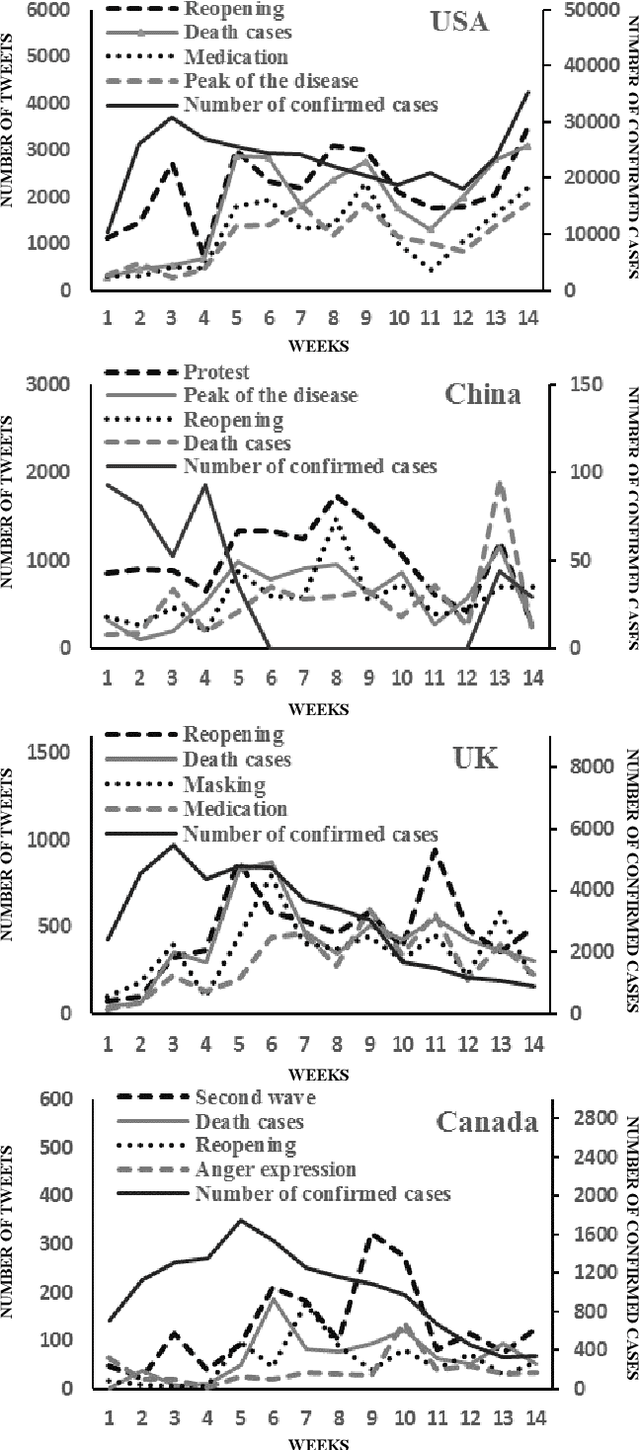
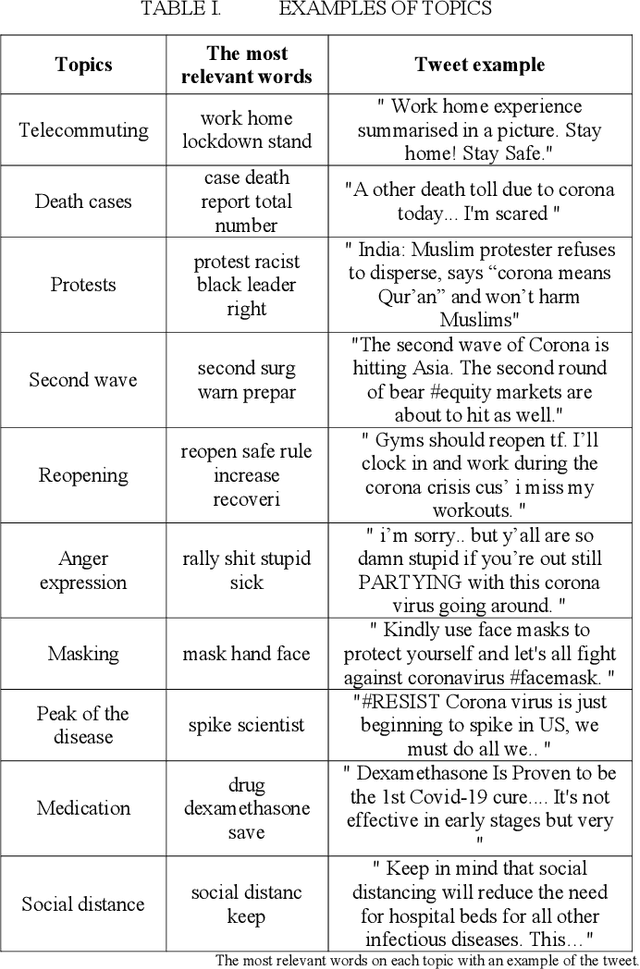
Abstract:With the outbreak of the Covid-19 virus, the activity of users on Twitter has significantly increased. Some studies have investigated the hot topics of tweets in this period; however, little attention has been paid to presenting and analyzing the spatial and temporal trends of Covid-19 topics. In this study, we use the topic modeling method to extract global topics during the nationwide quarantine periods (March 23 to June 23, 2020) on Covid-19 tweets. We implement the Latent Dirichlet Allocation (LDA) algorithm to extract the topics and then name them with the "reopening", "death cases", "telecommuting", "protests", "anger expression", "masking", "medication", "social distance", "second wave", and "peak of the disease" titles. We additionally analyze temporal trends of the topics for the whole world and four countries. By analyzing the graphs, fascinating results are obtained from altering users' focus on topics over time.
GSVMA: A Genetic-Support Vector Machine-Anova method for CAD diagnosis based on Z-Alizadeh Sani dataset
Jul 23, 2021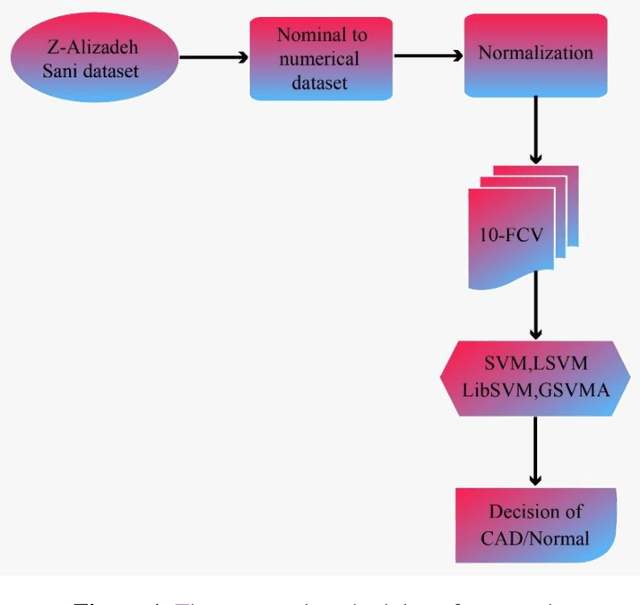
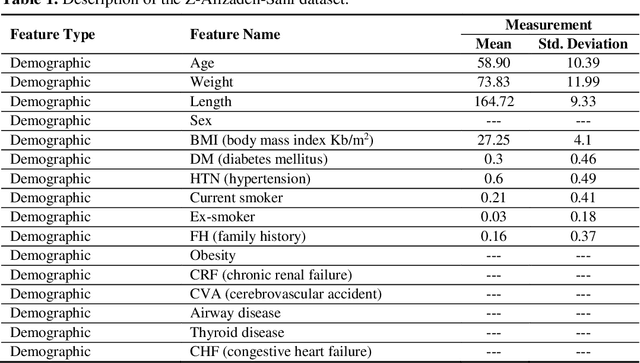
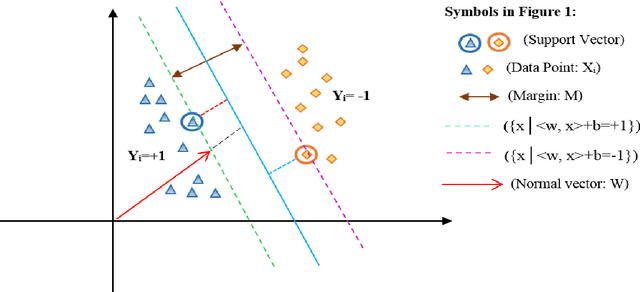
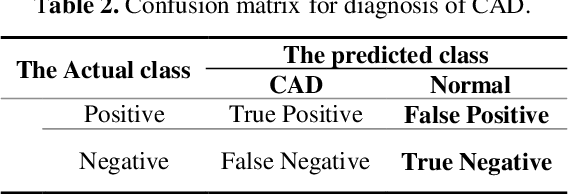
Abstract:Coronary heart disease (CAD) is one of the crucial reasons for cardiovascular mortality in middle-aged people worldwide. The most typical tool is angiography for diagnosing CAD. The challenges of CAD diagnosis using angiography are costly and have side effects. One of the alternative solutions is the use of machine learning-based patterns for CAD diagnosis. Hence, this paper provides a new hybrid machine learning model called Genetic Support Vector Machine and Analysis of Variance (GSVMA). The ANOVA is known as the kernel function for SVM. The proposed model is performed based on the Z-Alizadeh Sani dataset. A genetic optimization algorithm is used to select crucial features. In addition, SVM with Anova, Linear SVM, and LibSVM with radial basis function methods were applied to classify the dataset. As a result, the GSVMA hybrid method performs better than other methods. This proposed method has the highest accuracy of 89.45% through a 10-fold cross-validation technique with 35 selected features on the Z-Alizadeh Sani dataset. Therefore, the genetic optimization algorithm is very effective for improving accuracy. The computer-aided GSVMA method can be helped clinicians with CAD diagnosis.
 Add to Chrome
 Add to Firefox
 Add to Edge