Dirk Timmerman
topic group 6 of the STRATOS initiative
Performance evaluation of predictive AI models to support medical decisions: Overview and guidance
Dec 13, 2024


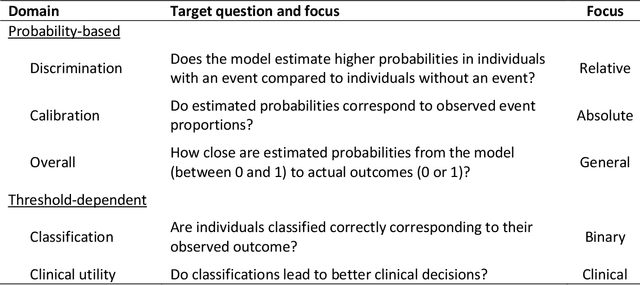
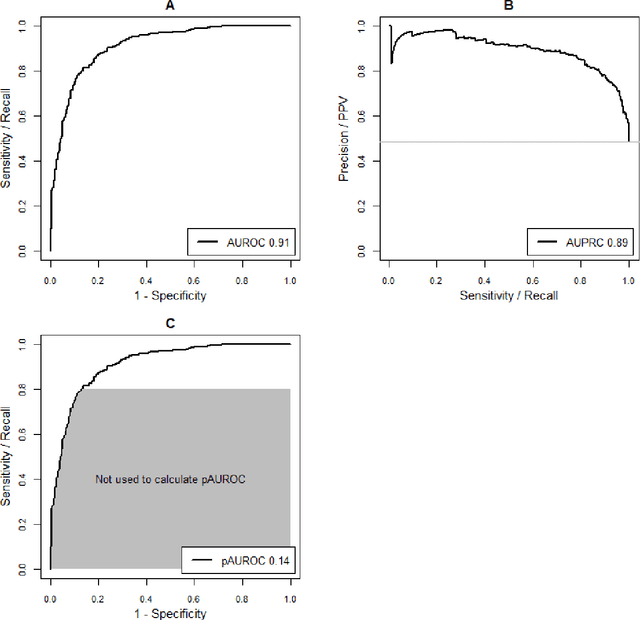
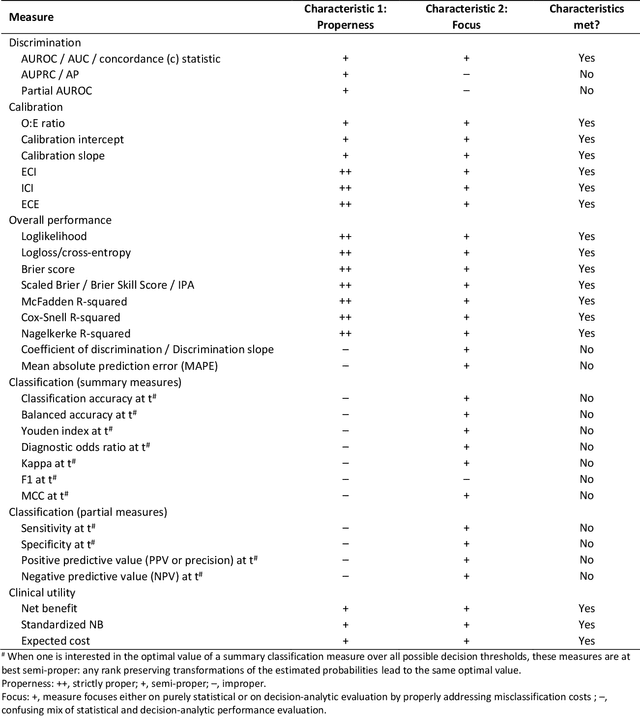
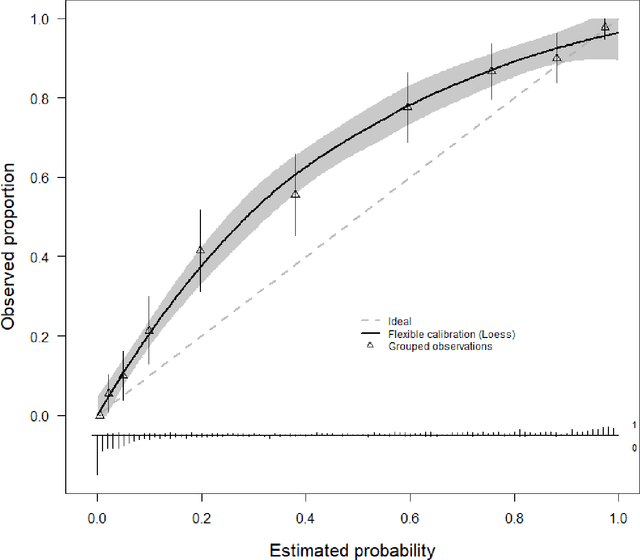
Abstract:A myriad of measures to illustrate performance of predictive artificial intelligence (AI) models have been proposed in the literature. Selecting appropriate performance measures is essential for predictive AI models that are developed to be used in medical practice, because poorly performing models may harm patients and lead to increased costs. We aim to assess the merits of classic and contemporary performance measures when validating predictive AI models for use in medical practice. We focus on models with a binary outcome. We discuss 32 performance measures covering five performance domains (discrimination, calibration, overall, classification, and clinical utility) along with accompanying graphical assessments. The first four domains cover statistical performance, the fifth domain covers decision-analytic performance. We explain why two key characteristics are important when selecting which performance measures to assess: (1) whether the measure's expected value is optimized when it is calculated using the correct probabilities (i.e., a "proper" measure), and (2) whether they reflect either purely statistical performance or decision-analytic performance by properly considering misclassification costs. Seventeen measures exhibit both characteristics, fourteen measures exhibited one characteristic, and one measure possessed neither characteristic (the F1 measure). All classification measures (such as classification accuracy and F1) are improper for clinically relevant decision thresholds other than 0.5 or the prevalence. We recommend the following measures and plots as essential to report: AUROC, calibration plot, a clinical utility measure such as net benefit with decision curve analysis, and a plot with probability distributions per outcome category.
Understanding random forests and overfitting: a visualization and simulation study
Feb 28, 2024Abstract:Random forests have become popular for clinical risk prediction modelling. In a case study on predicting ovarian malignancy, we observed training c-statistics close to 1. Although this suggests overfitting, performance was competitive on test data. We aimed to understand the behaviour of random forests by (1) visualizing data space in three real world case studies and (2) a simulation study. For the case studies, risk estimates were visualised using heatmaps in a 2-dimensional subspace. The simulation study included 48 logistic data generating mechanisms (DGM), varying the predictor distribution, the number of predictors, the correlation between predictors, the true c-statistic and the strength of true predictors. For each DGM, 1000 training datasets of size 200 or 4000 were simulated and RF models trained with minimum node size 2 or 20 using ranger package, resulting in 192 scenarios in total. The visualizations suggested that the model learned spikes of probability around events in the training set. A cluster of events created a bigger peak, isolated events local peaks. In the simulation study, median training c-statistics were between 0.97 and 1 unless there were 4 or 16 binary predictors with minimum node size 20. Median test c-statistics were higher with higher events per variable, higher minimum node size, and binary predictors. Median training slopes were always above 1, and were not correlated with median test slopes across scenarios (correlation -0.11). Median test slopes were higher with higher true c-statistic, higher minimum node size, and higher sample size. Random forests learn local probability peaks that often yield near perfect training c-statistics without strongly affecting c-statistics on test data. When the aim is probability estimation, the simulation results go against the common recommendation to use fully grown trees in random forest models.
 Add to Chrome
 Add to Firefox
 Add to Edge