Debajyoti Mondal
On the Use of Deep Learning Models for Semantic Clone Detection
Dec 19, 2024
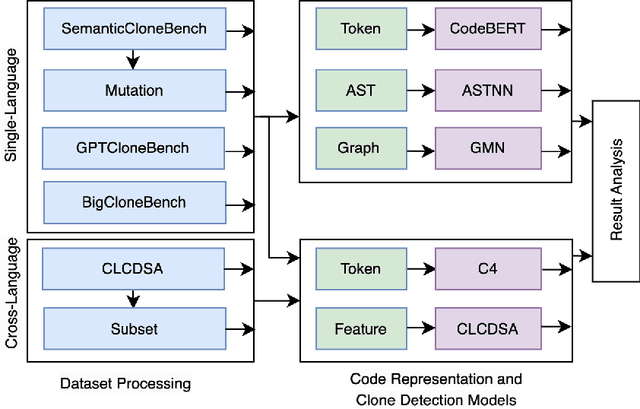
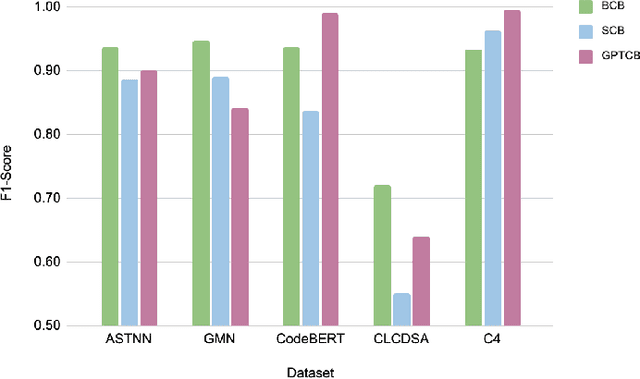

Abstract:Detecting and tracking code clones can ease various software development and maintenance tasks when changes in a code fragment should be propagated over all its copies. Several deep learning-based clone detection models have appeared in the literature for detecting syntactic and semantic clones, widely evaluated with the BigCloneBench dataset. However, class imbalance and the small number of semantic clones make BigCloneBench less ideal for interpreting model performance. Researchers also use other datasets such as GoogleCodeJam, OJClone, and SemanticCloneBench to understand model generalizability. To overcome the limitations of existing datasets, the GPT-assisted semantic and cross-language clone dataset GPTCloneBench has been released. However, how these models compare across datasets remains unclear. In this paper, we propose a multi-step evaluation approach for five state-of-the-art clone detection models leveraging existing benchmark datasets, including GPTCloneBench, and using mutation operators to study model ability. Specifically, we examine three highly-performing single-language models (ASTNN, GMN, CodeBERT) on BigCloneBench, SemanticCloneBench, and GPTCloneBench, testing their robustness with mutation operations. Additionally, we compare them against cross-language models (C4, CLCDSA) known for detecting semantic clones. While single-language models show high F1 scores for BigCloneBench, their performance on SemanticCloneBench varies (up to 20%). Interestingly, the cross-language model (C4) shows superior performance (around 7%) on SemanticCloneBench over other models and performs similarly on BigCloneBench and GPTCloneBench. On mutation-based datasets, C4 has more robust performance (less than 1% difference) compared to single-language models, which show high variability.
Leveraging Structural Properties of Source Code Graphs for Just-In-Time Bug Prediction
Jan 25, 2022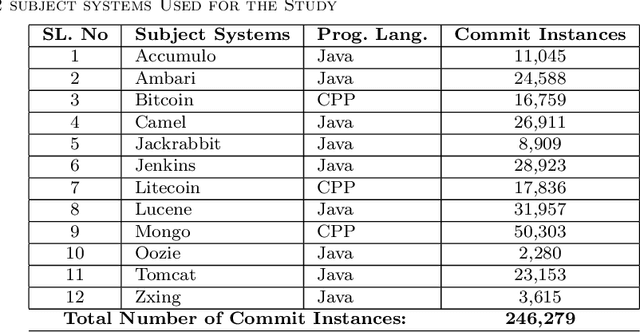
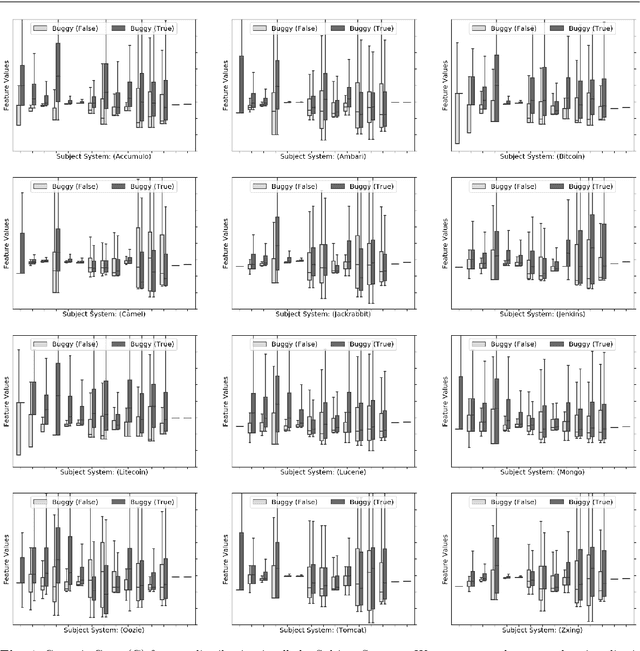
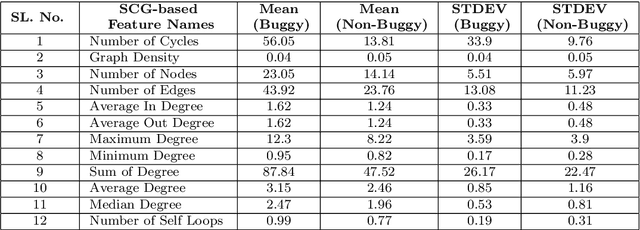
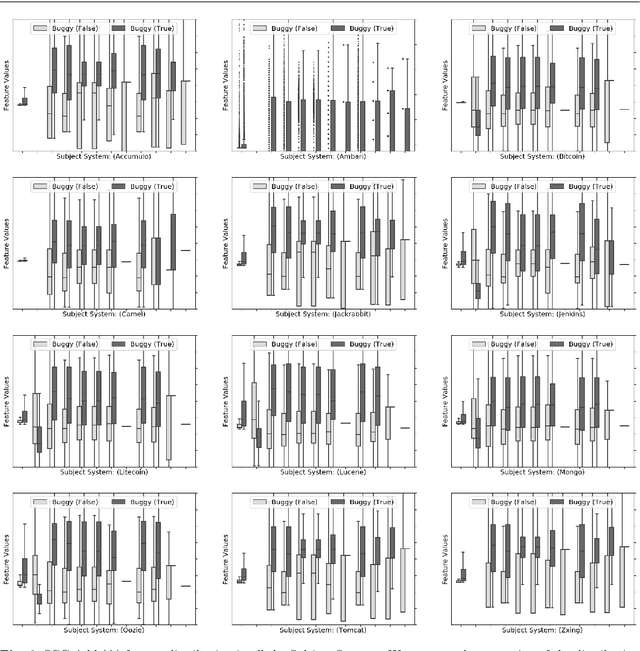
Abstract:The most common use of data visualization is to minimize the complexity for proper understanding. A graph is one of the most commonly used representations for understanding relational data. It produces a simplified representation of data that is challenging to comprehend if kept in a textual format. In this study, we propose a methodology to utilize the relational properties of source code in the form of a graph to identify Just-in-Time (JIT) bug prediction in software systems during different revisions of software evolution and maintenance. We presented a method to convert the source codes of commit patches to equivalent graph representations and named it Source Code Graph (SCG). To understand and compare multiple source code graphs, we extracted several structural properties of these graphs, such as the density, number of cycles, nodes, edges, etc. We then utilized the attribute values of those SCGs to visualize and detect buggy software commits. We process more than 246K software commits from 12 subject systems in this investigation. Our investigation on these 12 open-source software projects written in C++ and Java programming languages shows that if we combine the features from SCG with conventional features used in similar studies, we will get the increased performance of Machine Learning (ML) based buggy commit detection models. We also find the increase of F1~Scores in predicting buggy and non-buggy commits statistically significant using the Wilcoxon Signed Rank Test. Since SCG-based feature values represent the style or structural properties of source code updates or changes in the software system, it suggests the importance of careful maintenance of source code style or structure for keeping a software system bug-free.
BigGraphVis: Leveraging Streaming Algorithms and GPU Acceleration for Visualizing Big Graphs
Aug 01, 2021


Abstract:Graph layouts are key to exploring massive graphs. An enormous number of nodes and edges do not allow network analysis software to produce meaningful visualization of the pervasive networks. Long computation time, memory and display limitations encircle the software's ability to explore massive graphs. This paper introduces BigGraphVis, a new parallel graph visualization method that uses GPU parallel processing and community detection algorithm to visualize graph communities. We combine parallelized streaming community detection algorithm and probabilistic data structure to leverage parallel processing of Graphics Processing Unit (GPU). To the best of our knowledge, this is the first attempt to combine the power of streaming algorithms coupled with GPU computing to tackle big graph visualization challenges. Our method extracts community information in a few passes on the edge list, and renders the community structures using the ForceAtlas2 algorithm. Our experiment with massive real-life graphs indicates that about 70 to 95 percent speedup can be achieved by visualizing graph communities, and the visualization appears to be meaningful and reliable. The biggest graph that we examined contains above 3 million nodes and 34 million edges, and the layout computation took about five minutes. We also observed that the BigGraphVis coloring strategy can be successfully applied to produce a more informative ForceAtlas2 layout.
On the Evolution of Neuron Communities in a Deep Learning Architecture
Jun 08, 2021


Abstract:Deep learning techniques are increasingly being adopted for classification tasks over the past decade, yet explaining how deep learning architectures can achieve state-of-the-art performance is still an elusive goal. While all the training information is embedded deeply in a trained model, we still do not understand much about its performance by only analyzing the model. This paper examines the neuron activation patterns of deep learning-based classification models and explores whether the models' performances can be explained through neurons' activation behavior. We propose two approaches: one that models neurons' activation behavior as a graph and examines whether the neurons form meaningful communities, and the other examines the predictability of neurons' behavior using entropy. Our comprehensive experimental study reveals that both the community quality (modularity) and entropy are closely related to the deep learning models' performances, thus paves a novel way of explaining deep learning models directly from the neurons' activation pattern.
 Add to Chrome
 Add to Firefox
 Add to Edge