Leveraging Structural Properties of Source Code Graphs for Just-In-Time Bug Prediction
Paper and Code
Jan 25, 2022


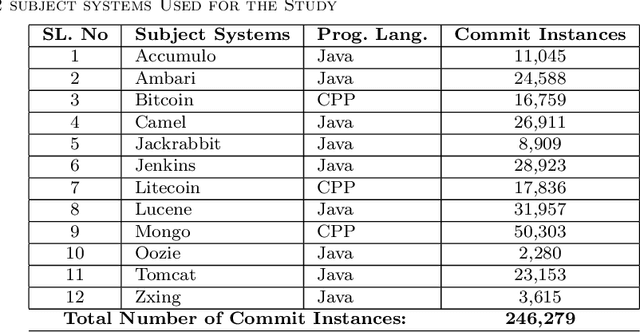
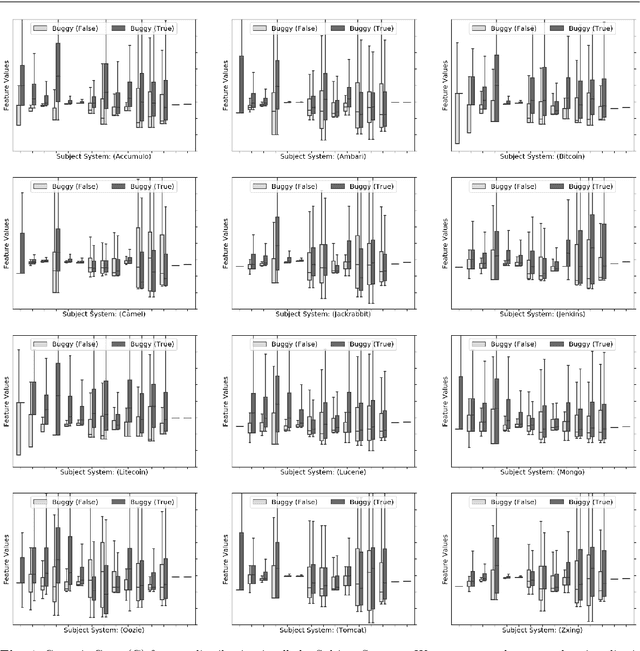
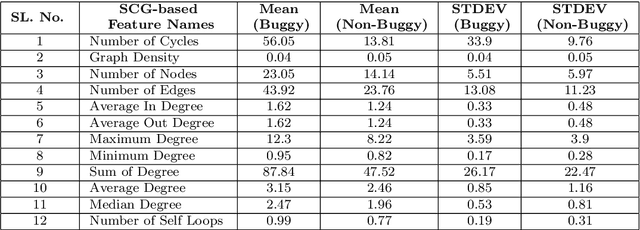
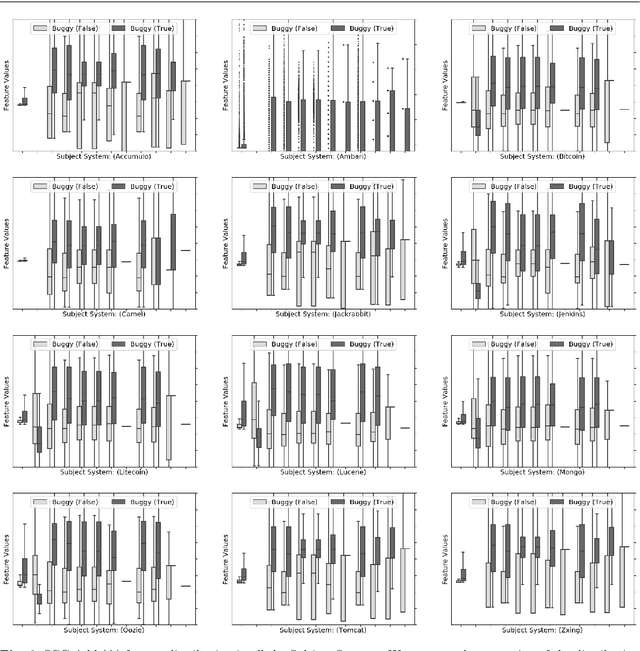
The most common use of data visualization is to minimize the complexity for proper understanding. A graph is one of the most commonly used representations for understanding relational data. It produces a simplified representation of data that is challenging to comprehend if kept in a textual format. In this study, we propose a methodology to utilize the relational properties of source code in the form of a graph to identify Just-in-Time (JIT) bug prediction in software systems during different revisions of software evolution and maintenance. We presented a method to convert the source codes of commit patches to equivalent graph representations and named it Source Code Graph (SCG). To understand and compare multiple source code graphs, we extracted several structural properties of these graphs, such as the density, number of cycles, nodes, edges, etc. We then utilized the attribute values of those SCGs to visualize and detect buggy software commits. We process more than 246K software commits from 12 subject systems in this investigation. Our investigation on these 12 open-source software projects written in C++ and Java programming languages shows that if we combine the features from SCG with conventional features used in similar studies, we will get the increased performance of Machine Learning (ML) based buggy commit detection models. We also find the increase of F1~Scores in predicting buggy and non-buggy commits statistically significant using the Wilcoxon Signed Rank Test. Since SCG-based feature values represent the style or structural properties of source code updates or changes in the software system, it suggests the importance of careful maintenance of source code style or structure for keeping a software system bug-free.
 Add to Chrome
 Add to Firefox
 Add to Edge