Baofeng Chang
An Integrated Visual Analytics System for Studying Clinical Carotid Artery Plaques
Aug 09, 2023


Abstract:Carotid artery plaques can cause arterial vascular diseases such as stroke and myocardial infarction, posing a severe threat to human life. However, the current clinical examination mainly relies on a direct assessment by physicians of patients' clinical indicators and medical images, lacking an integrated visualization tool for analyzing the influencing factors and composition of carotid artery plaques. We have designed an intelligent carotid artery plaque visual analysis system for vascular surgery experts to comprehensively analyze the clinical physiological and imaging indicators of carotid artery diseases. The system mainly includes two functions: First, it displays the correlation between carotid artery plaque and various factors through a series of information visualization methods and integrates the analysis of patient physiological indicator data. Second, it enhances the interface guidance analysis of the inherent correlation between the components of carotid artery plaque through machine learning and displays the spatial distribution of the plaque on medical images. Additionally, we conducted two case studies on carotid artery plaques using real data obtained from a hospital, and the results indicate that our designed carotid analysis system can effectively provide clinical diagnosis and treatment guidance for vascular surgeons.
VAC2: Visual Analysis of Combined Causality in Event Sequences
Jun 11, 2022
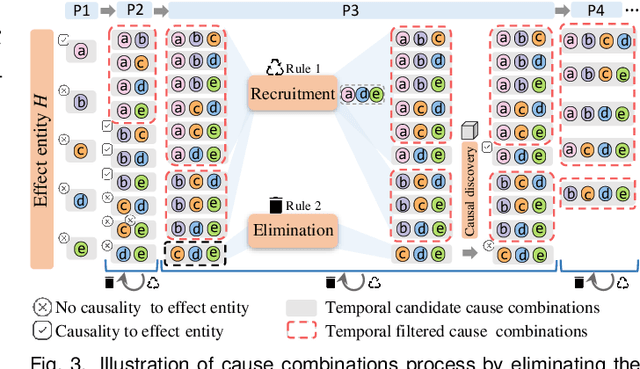
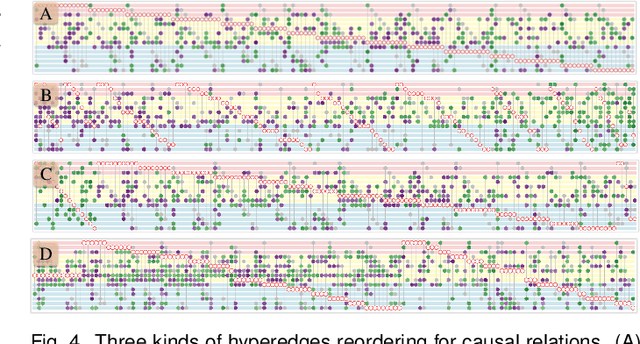
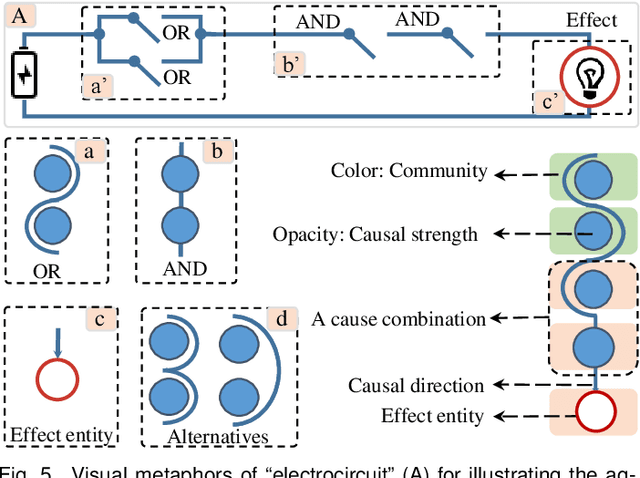
Abstract:Identifying causality behind complex systems plays a significant role in different domains, such as decision making, policy implementations, and management recommendations. However, existing causality studies on temporal event sequences data mainly focus on individual causal discovery, which is incapable of exploiting combined causality. To fill the absence of combined causes discovery on temporal event sequence data,eliminating and recruiting principles are defined to balance the effectiveness and controllability on cause combinations. We also leverage the Granger causality algorithm based on the reactive point processes to describe impelling or inhibiting behavior patterns among entities. In addition, we design an informative and aesthetic visual metaphor of "electrocircuit" to encode aggregated causality for ensuring our causality visualization is non-overlapping and non-intersecting. Diverse sorting strategies and aggregation layout are also embedded into our parallel-based, directed and weighted hypergraph for illustrating combined causality. Our developed combined causality visual analysis system can help users effectively explore combined causes as well as an individual cause. This interactive system supports multi-level causality exploration with diverse ordering strategies and a focus and context technique to help users obtain different levels of information abstraction. The usefulness and effectiveness of the system are further evaluated by conducting a pilot user study and two case studies on event sequence data.
DGSVis: Visual Analysis of Hierarchical Snapshots in Dynamic Graph
May 26, 2022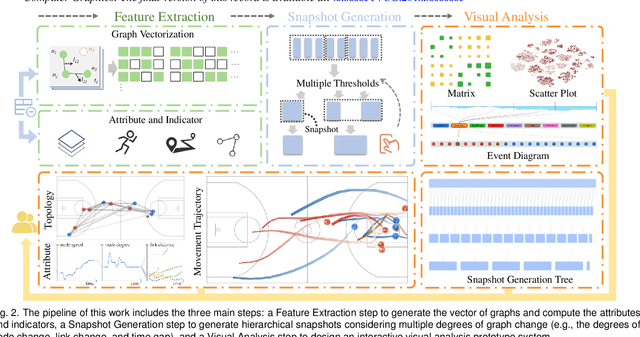


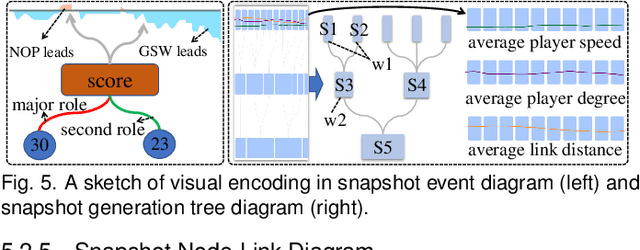
Abstract:Dynamic graph visualization attracts researchers' concentration as it represents time-varying relationships between entities in multiple domains (e.g., social media analysis, academic cooperation analysis, team sports analysis). Integrating visual analytic methods is consequential in presenting, comparing, and reviewing dynamic graphs. Even though dynamic graph visualization is developed for many years, how to effectively visualize large-scale and time-intensive dynamic graph data with subtle changes is still challenging for researchers. To provide an effective analysis method for this type of dynamic graph data, we propose a snapshot generation algorithm involving Human-In-Loop to help users divide the dynamic graphs into multi-granularity and hierarchical snapshots for further analysis. In addition, we design a visual analysis prototype system (DGSVis) to assist users in accessing the dynamic graph insights effectively. DGSVis integrates a graphical operation interface to help users generate snapshots visually and interactively. It is equipped with the overview and details for visualizing hierarchical snapshots of the dynamic graph data. To illustrate the usability and efficiency of our proposed methods for this type of dynamic graph data, we introduce two case studies based on basketball player networks in a competition. In addition, we conduct an evaluation and receive exciting feedback from experienced visualization experts.
 Add to Chrome
 Add to Firefox
 Add to Edge