Ali Javed
A Lightweight and Interpretable Deepfakes Detection Framework
Jan 21, 2025


Abstract:The recent realistic creation and dissemination of so-called deepfakes poses a serious threat to social life, civil rest, and law. Celebrity defaming, election manipulation, and deepfakes as evidence in court of law are few potential consequences of deepfakes. The availability of open source trained models based on modern frameworks such as PyTorch or TensorFlow, video manipulations Apps such as FaceApp and REFACE, and economical computing infrastructure has easen the creation of deepfakes. Most of the existing detectors focus on detecting either face-swap, lip-sync, or puppet master deepfakes, but a unified framework to detect all three types of deepfakes is hardly explored. This paper presents a unified framework that exploits the power of proposed feature fusion of hybrid facial landmarks and our novel heart rate features for detection of all types of deepfakes. We propose novel heart rate features and fused them with the facial landmark features to better extract the facial artifacts of fake videos and natural variations available in the original videos. We used these features to train a light-weight XGBoost to classify between the deepfake and bonafide videos. We evaluated the performance of our framework on the world leaders dataset (WLDR) that contains all types of deepfakes. Experimental results illustrate that the proposed framework offers superior detection performance over the comparative deepfakes detection methods. Performance comparison of our framework against the LSTM-FCN, a candidate of deep learning model, shows that proposed model achieves similar results, however, it is more interpretable.
SOMTimeS: Self Organizing Maps for Time Series Clustering and its Application to Serious Illness Conversations
Aug 26, 2021


Abstract:There is an increasing demand for scalable algorithms capable of clustering and analyzing large time series datasets. The Kohonen self-organizing map (SOM) is a type of unsupervised artificial neural network for visualizing and clustering complex data, reducing the dimensionality of data, and selecting influential features. Like all clustering methods, the SOM requires a measure of similarity between input data (in this work time series). Dynamic time warping (DTW) is one such measure, and a top performer given that it accommodates the distortions when aligning time series. Despite its use in clustering, DTW is limited in practice because it is quadratic in runtime complexity with the length of the time series data. To address this, we present a new DTW-based clustering method, called SOMTimeS (a Self-Organizing Map for TIME Series), that scales better and runs faster than other DTW-based clustering algorithms, and has similar performance accuracy. The computational performance of SOMTimeS stems from its ability to prune unnecessary DTW computations during the SOM's training phase. We also implemented a similar pruning strategy for K-means for comparison with one of the top performing clustering algorithms. We evaluated the pruning effectiveness, accuracy, execution time and scalability on 112 benchmark time series datasets from the University of California, Riverside classification archive. We showed that for similar accuracy, the speed-up achieved for SOMTimeS and K-means was 1.8x on average; however, rates varied between 1x and 18x depending on the dataset. SOMTimeS and K-means pruned 43% and 50% of the total DTW computations, respectively. We applied SOMtimeS to natural language conversation data collected as part of a large healthcare cohort study of patient-clinician serious illness conversations to demonstrate the algorithm's utility with complex, temporally sequenced phenomena.
Deepfakes Generation and Detection: State-of-the-art, open challenges, countermeasures, and way forward
Feb 25, 2021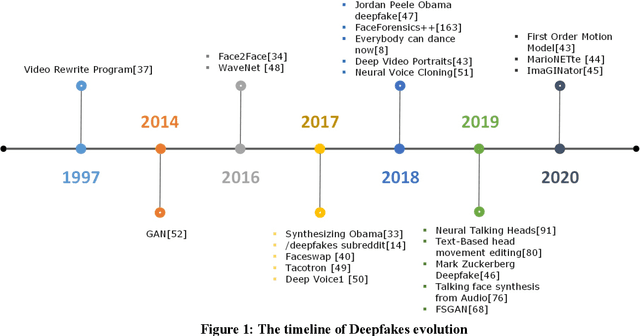
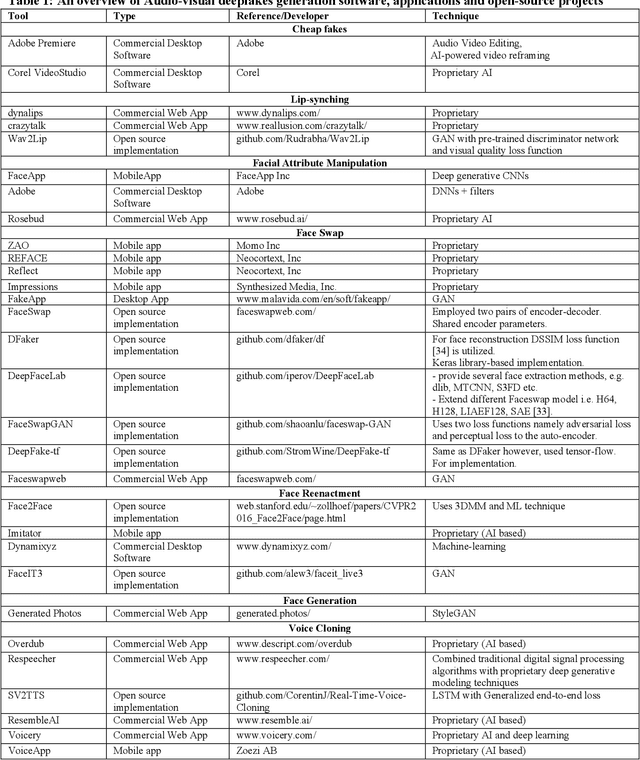

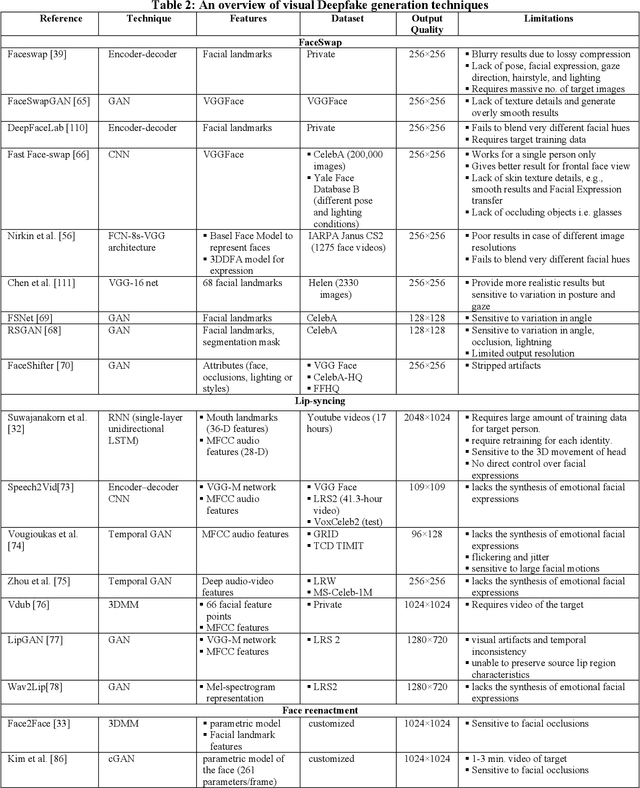
Abstract:Easy access to audio-visual content on social media, combined with the availability of modern tools such as Tensorflow or Keras, open-source trained models, and economical computing infrastructure, and the rapid evolution of deep-learning (DL) methods, especially Generative Adversarial Networks (GAN), have made it possible to generate deepfakes to disseminate disinformation, revenge porn, financial frauds, hoaxes, and to disrupt government functioning. The existing surveys have mainly focused on deepfake video detection only. No attempt has been made to review approaches for detection and generation of both audio and video deepfakes. This paper provides a comprehensive review and detailed analysis of existing tools and machine learning (ML) based approaches for deepfake generation and the methodologies used to detect such manipulations for the detection and generation of both audio and video deepfakes. For each category of deepfake, we discuss information related to manipulation approaches, current public datasets, and key standards for the performance evaluation of deepfake detection techniques along with their results. Additionally, we also discuss open challenges and enumerate future directions to guide future researchers on issues that need to be considered to improve the domains of both the deepfake generation and detection. This work is expected to assist the readers in understanding the creation and detection mechanisms of deepfake, along with their current limitations and future direction.
A Benchmark Study on Time Series Clustering
Apr 26, 2020


Abstract:This paper presents the first time series clustering benchmark utilizing all time series datasets currently available in the University of California Riverside (UCR) archive -- the state of the art repository of time series data. Specifically, the benchmark examines eight popular clustering methods representing three categories of clustering algorithms (partitional, hierarchical and density-based) and three types of distance measures (Euclidean, dynamic time warping, and shape-based). We lay out six restrictions with special attention to making the benchmark as unbiased as possible. A phased evaluation approach was then designed for summarizing dataset-level assessment metrics and discussing the results. The benchmark study presented can be a useful reference for the research community on its own; and the dataset-level assessment metrics reported may be used for designing evaluation frameworks to answer different research questions.
Analysis of Hydrological and Suspended Sediment Events from Mad River Wastershed using Multivariate Time Series Clustering
Nov 28, 2019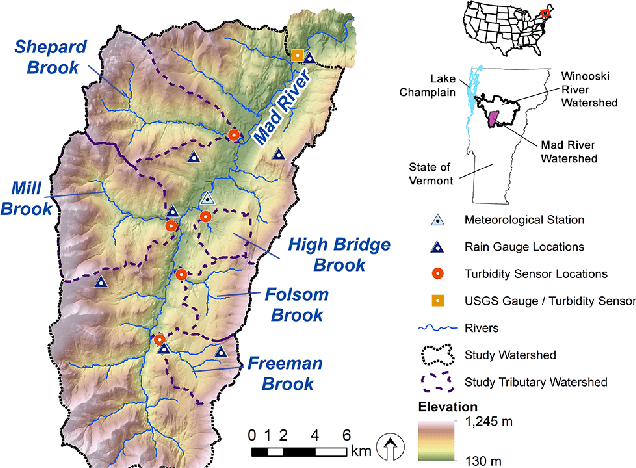
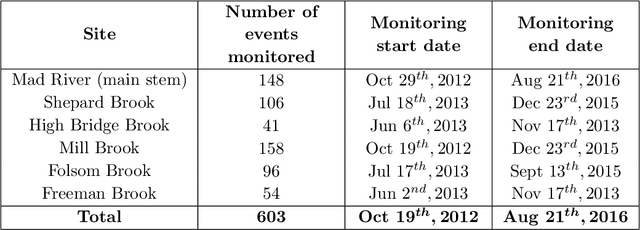
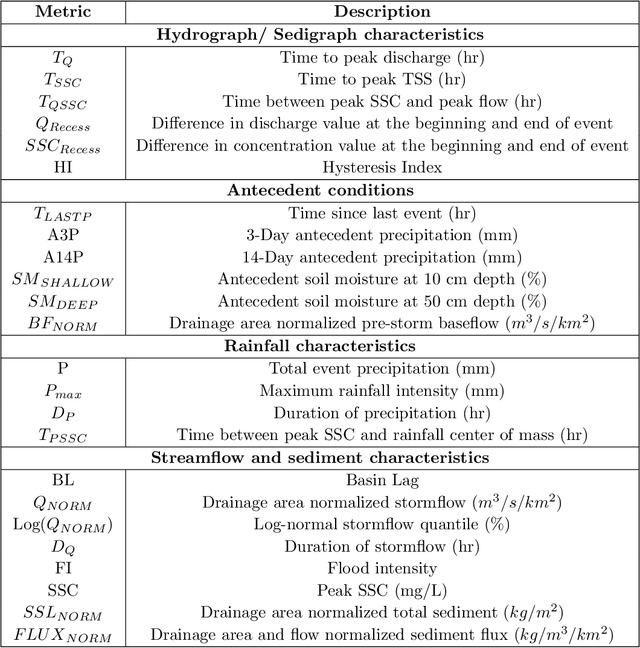
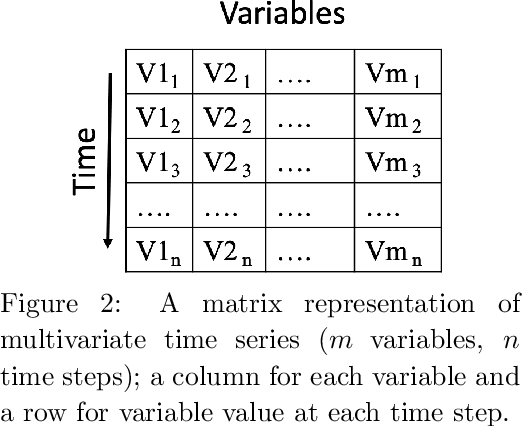
Abstract:Hydrological storm events are a primary driver for transporting water quality constituents such as turbidity, suspended sediments and nutrients. Analyzing the concentration (C) of these water quality constituents in response to increased streamflow discharge (Q), particularly when monitored at high temporal resolution during a hydrological event, helps to characterize the dynamics and flux of such constituents. A conventional approach to storm event analysis is to reduce the C-Q time series to two-dimensional (2-D) hysteresis loops and analyze these 2-D patterns. While effective and informative to some extent, this hysteresis loop approach has limitations because projecting the C-Q time series onto a 2-D plane obscures detail (e.g., temporal variation) associated with the C-Q relationships. In this paper, we address this issue using a multivariate time series clustering approach. Clustering is applied to sequences of river discharge and suspended sediment data (acquired through turbidity-based monitoring) from six watersheds located in the Lake Champlain Basin in the northeastern United States. While clusters of the hydrological storm events using the multivariate time series approach were found to be correlated to 2-D hysteresis loop classifications and watershed locations, the clusters differed from the 2-D hysteresis classifications. Additionally, using available meteorological data associated with storm events, we examine the characteristics of computational clusters of storm events in the study watersheds and identify the features driving the clustering approach.
 Add to Chrome
 Add to Firefox
 Add to Edge