Trajectories, bifurcations and pseudotime in large clinical datasets: applications to myocardial infarction and diabetes data
Paper and Code
Jul 07, 2020


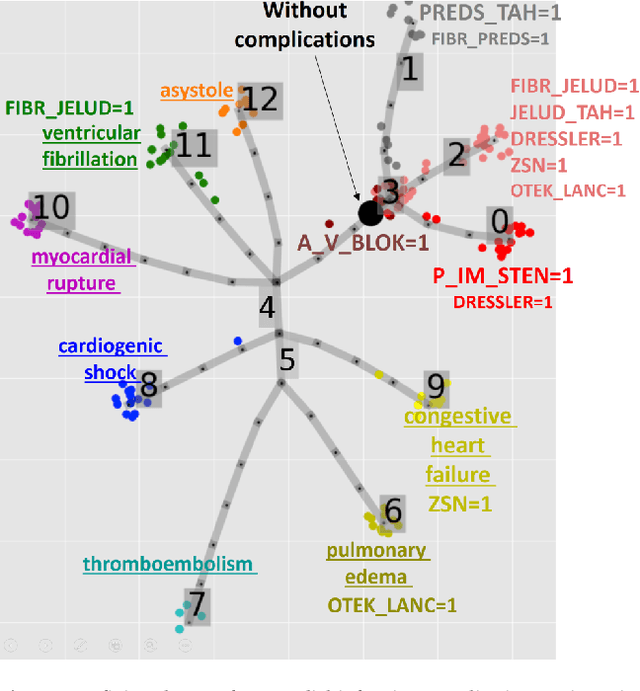
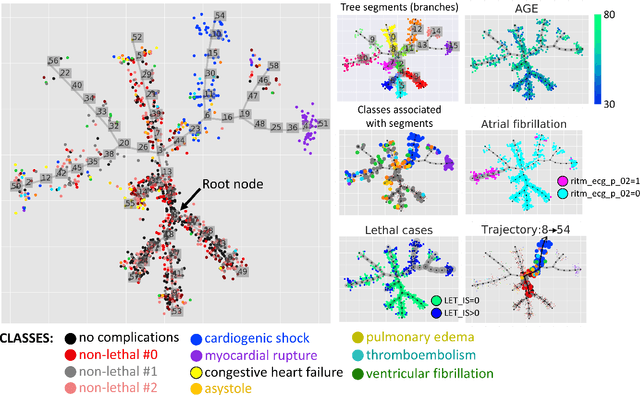
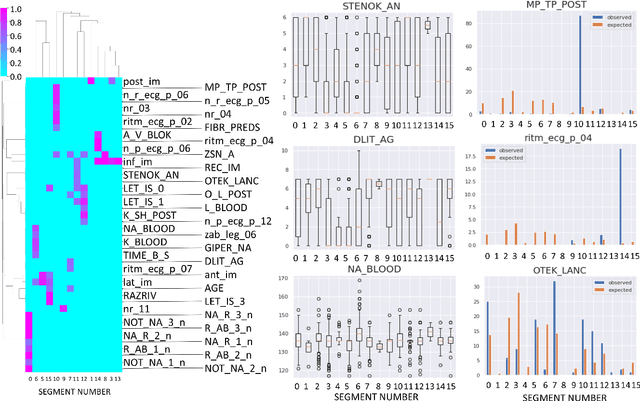
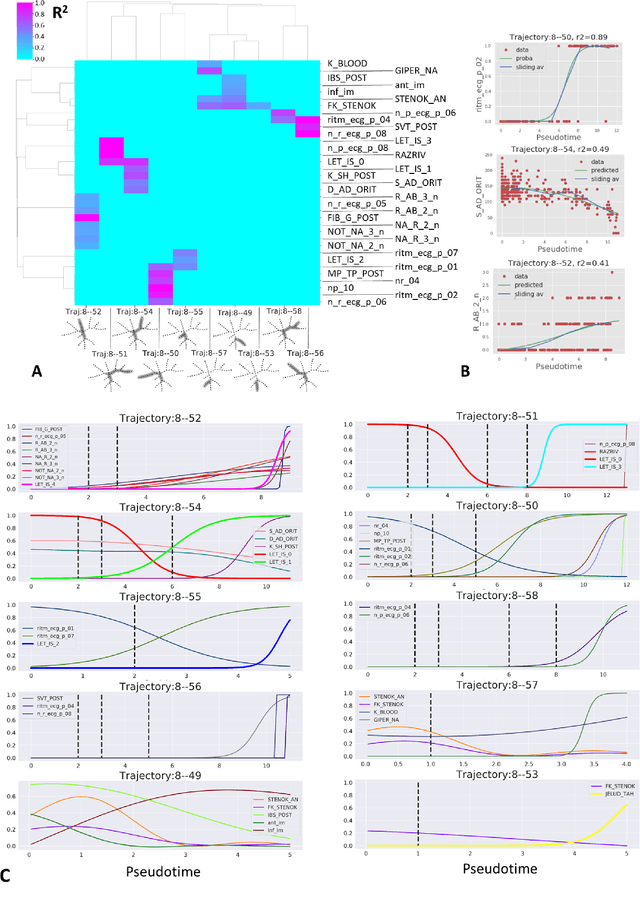
Large observational clinical datasets become increasingly available for mining associations between various disease traits and administered therapy. These datasets can be considered as representations of the landscape of all possible disease conditions, in which a concrete pathology develops through a number of stereotypical routes, characterized by `points of no return' and `final states' (such as lethal or recovery states). Extracting this information directly from the data remains challenging, especially in the case of synchronic (with a short-term follow up) observations. Here we suggest a semi-supervised methodology for the analysis of large clinical datasets, characterized by mixed data types and missing values, through modeling the geometrical data structure as a bouquet of bifurcating clinical trajectories. The methodology is based on application of elastic principal graphs which can address simultaneously the tasks of dimensionality reduction, data visualization, clustering, feature selection and quantifying the geodesic distances (pseudotime) in partially ordered sequences of observations. The methodology allows positioning a patient on a particular clinical trajectory (pathological scenario) and characterizing the degree of progression along it with a qualitative estimate of the uncertainty of the prognosis. Overall, our pseudo-time quantification-based approach gives a possibility to apply the methods developed for dynamical disease phenotyping and illness trajectory analysis (diachronic data analysis) to synchronic observational data. We developed a tool $ClinTrajan$ for clinical trajectory analysis implemented in Python programming language. We test the methodology in two large publicly available datasets: myocardial infarction complications and readmission of diabetic patients data.
 Add to Chrome
 Add to Firefox
 Add to Edge