ICDAR 2021 Competition on Document VisualQuestion Answering
Paper and Code
Nov 10, 2021


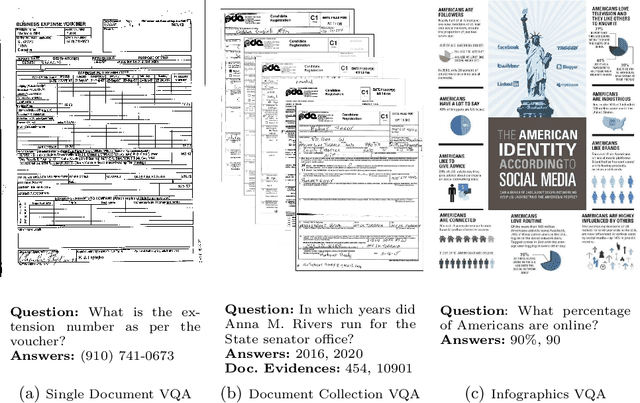
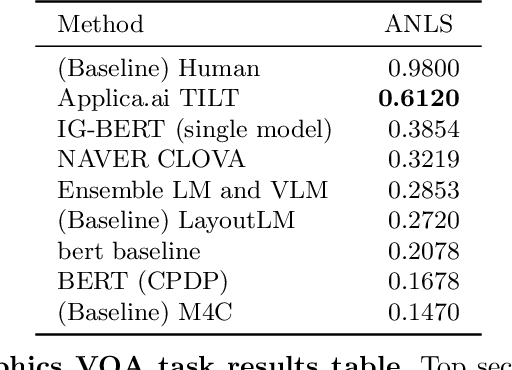
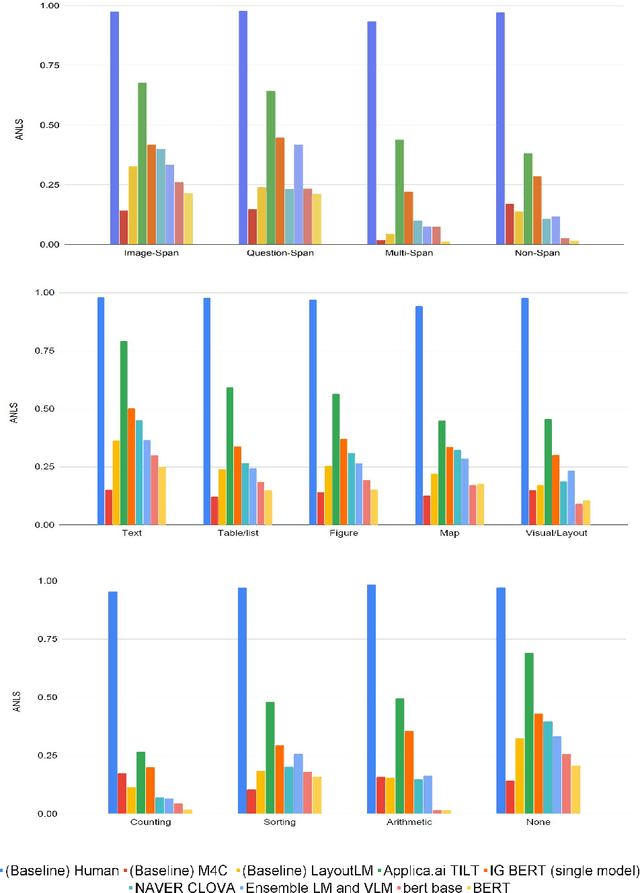
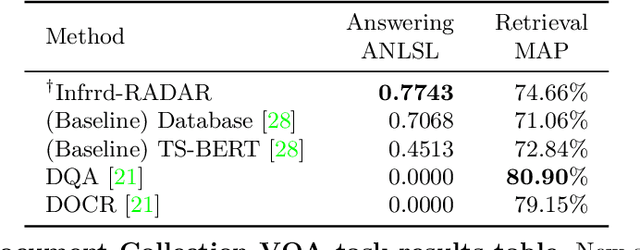
In this report we present results of the ICDAR 2021 edition of the Document Visual Question Challenges. This edition complements the previous tasks on Single Document VQA and Document Collection VQA with a newly introduced on Infographics VQA. Infographics VQA is based on a new dataset of more than 5,000 infographics images and 30,000 question-answer pairs. The winner methods have scored 0.6120 ANLS in Infographics VQA task, 0.7743 ANLSL in Document Collection VQA task and 0.8705 ANLS in Single Document VQA. We present a summary of the datasets used for each task, description of each of the submitted methods and the results and analysis of their performance. A summary of the progress made on Single Document VQA since the first edition of the DocVQA 2020 challenge is also presented.
 Add to Chrome
 Add to Firefox
 Add to Edge