 Add to Chrome
 Add to Firefox
 Add to Edge
DynaGraph: Interpretable Multi-Label Prediction from EHRs via Dynamic Graph Learning and Contrastive Augmentation
Paper and Code
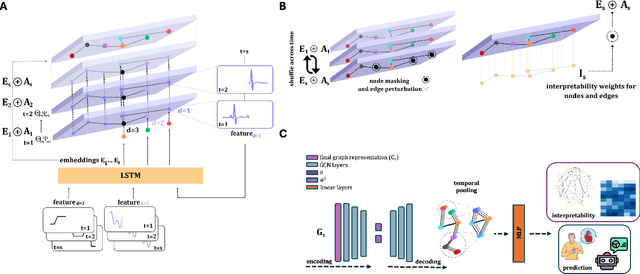
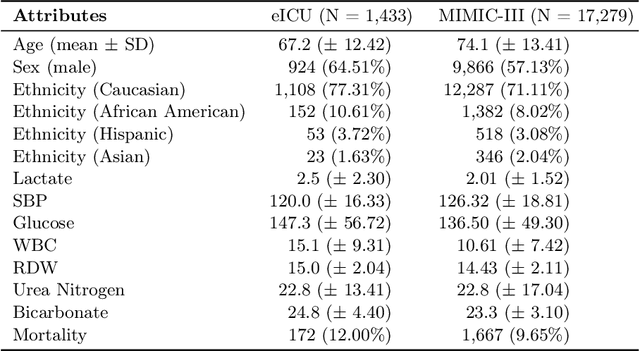
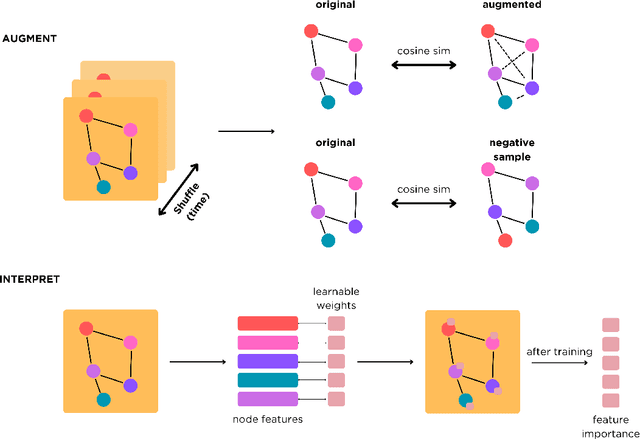
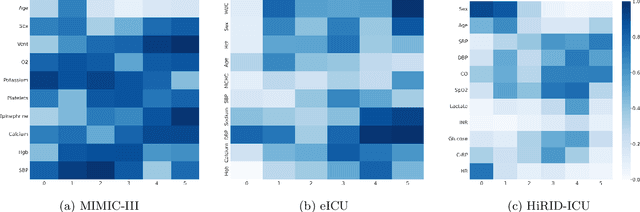
Learning from longitudinal electronic health records is limited if it does not capture the temporal trajectories of the patient's state in a clinical setting. Graph models allow us to capture the hidden dependencies of the multivariate time-series when the graphs are constructed in a similar dynamic manner. Previous dynamic graph models require a pre-defined and/or static graph structure, which is unknown in most cases, or they only capture the spatial relations between the features. Furthermore in healthcare, the interpretability of the model is an essential requirement to build trust with clinicians. In addition to previously proposed attention mechanisms, there has not been an interpretable dynamic graph framework for data from multivariate electronic health records (EHRs). Here, we propose DynaGraph, an end-to-end interpretable contrastive graph model that learns the dynamics of multivariate time-series EHRs as part of optimisation. We validate our model in four real-world clinical datasets, ranging from primary care to secondary care settings with broad demographics, in challenging settings where tasks are imbalanced and multi-labelled. Compared to state-of-the-art models, DynaGraph achieves significant improvements in balanced accuracy and sensitivity over the nearest complex competitors in time-series or dynamic graph modelling across three ICU and one primary care datasets. Through a pseudo-attention approach to graph construction, our model also indicates the importance of clinical covariates over time, providing means for clinical validation.