Dependency Networks for Collaborative Filtering and Data Visualization
Paper and Code
Jan 16, 2013


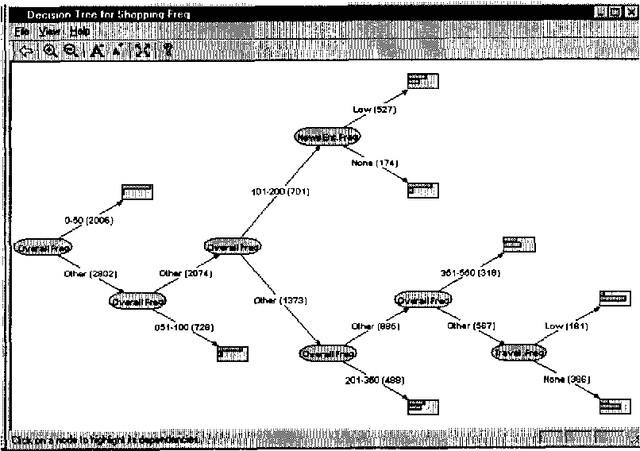
We describe a graphical model for probabilistic relationships---an alternative to the Bayesian network---called a dependency network. The graph of a dependency network, unlike a Bayesian network, is potentially cyclic. The probability component of a dependency network, like a Bayesian network, is a set of conditional distributions, one for each node given its parents. We identify several basic properties of this representation and describe a computationally efficient procedure for learning the graph and probability components from data. We describe the application of this representation to probabilistic inference, collaborative filtering (the task of predicting preferences), and the visualization of acausal predictive relationships.
* Appears in Proceedings of the Sixteenth Conference on Uncertainty in
Artificial Intelligence (UAI2000)
 Add to Chrome
 Add to Firefox
 Add to Edge