Comparing linear structure-based and data-driven latent spatial representations for sequence prediction
Paper and Code
Aug 19, 2019


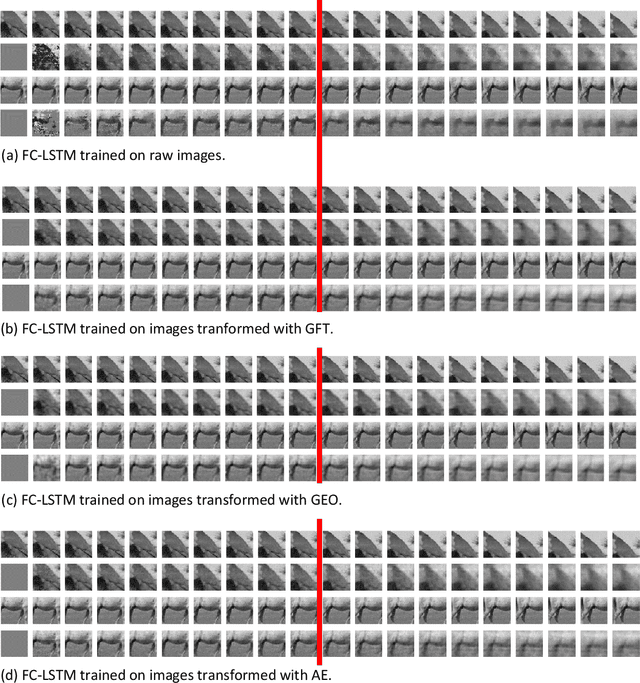
Predicting the future of Graph-supported Time Series (GTS) is a key challenge in many domains, such as climate monitoring, finance or neuroimaging. Yet it is a highly difficult problem as it requires to account jointly for time and graph (spatial) dependencies. To simplify this process, it is common to use a two-step procedure in which spatial and time dependencies are dealt with separately. In this paper, we are interested in comparing various linear spatial representations, namely structure-based ones and data-driven ones, in terms of how they help predict the future of GTS. To that end, we perform experiments with various datasets including spontaneous brain activity and raw videos.
* Wavelets and Sparsity XVIII, Aug 2019, San Diego, United States
 Add to Chrome
 Add to Firefox
 Add to Edge