Vivswan Shitole
From Heatmaps to Structural Explanations of Image Classifiers
Sep 13, 2021


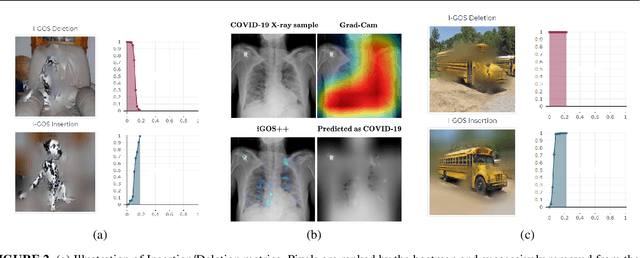
Abstract:This paper summarizes our endeavors in the past few years in terms of explaining image classifiers, with the aim of including negative results and insights we have gained. The paper starts with describing the explainable neural network (XNN), which attempts to extract and visualize several high-level concepts purely from the deep network, without relying on human linguistic concepts. This helps users understand network classifications that are less intuitive and substantially improves user performance on a difficult fine-grained classification task of discriminating among different species of seagulls. Realizing that an important missing piece is a reliable heatmap visualization tool, we have developed I-GOS and iGOS++ utilizing integrated gradients to avoid local optima in heatmap generation, which improved the performance across all resolutions. During the development of those visualizations, we realized that for a significant number of images, the classifier has multiple different paths to reach a confident prediction. This has lead to our recent development of structured attention graphs (SAGs), an approach that utilizes beam search to locate multiple coarse heatmaps for a single image, and compactly visualizes a set of heatmaps by capturing how different combinations of image regions impact the confidence of a classifier. Through the research process, we have learned much about insights in building deep network explanations, the existence and frequency of multiple explanations, and various tricks of the trade that make explanations work. In this paper, we attempt to share those insights and opinions with the readers with the hope that some of them will be informative for future researchers on explainable deep learning.
Structured Attention Graphs for Understanding Deep Image Classifications
Dec 08, 2020


Abstract:Attention maps are a popular way of explaining the decisions of convolutional networks for image classification. Typically, for each image of interest, a single attention map is produced, which assigns weights to pixels based on their importance to the classification. A single attention map, however, provides an incomplete understanding since there are often many other maps that explain a classification equally well. In this paper, we introduce structured attention graphs (SAGs), which compactly represent sets of attention maps for an image by capturing how different combinations of image regions impact a classifier's confidence. We propose an approach to compute SAGs and a visualization for SAGs so that deeper insight can be gained into a classifier's decisions. We conduct a user study comparing the use of SAGs to traditional attention maps for answering counterfactual questions about image classifications. Our results show that the users are more correct when answering comparative counterfactual questions based on SAGs compared to the baselines.
 Add to Chrome
 Add to Firefox
 Add to Edge