Trent Henderson
Never a Dull Moment: Distributional Properties as a Baseline for Time-Series Classification
Mar 31, 2023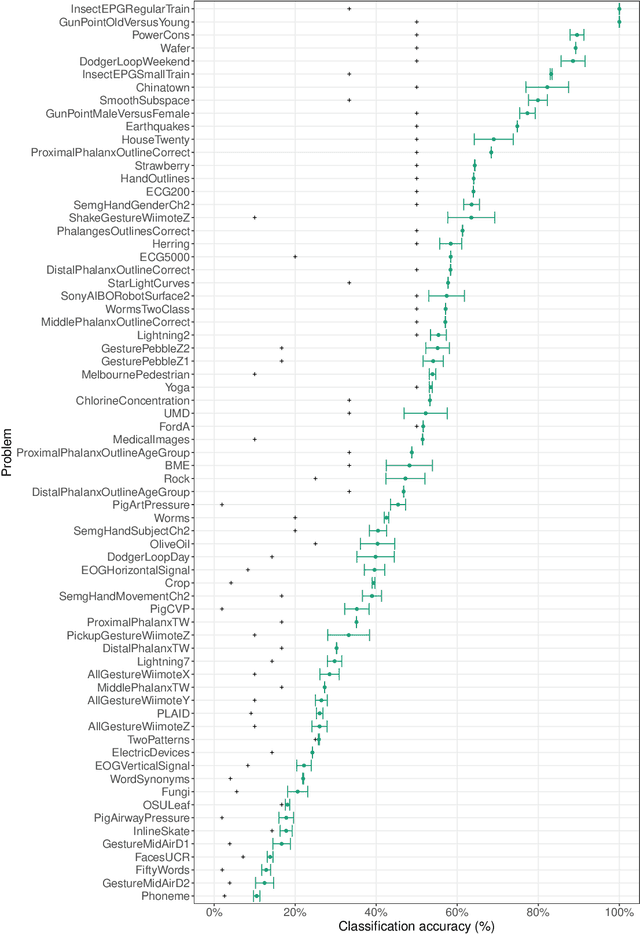
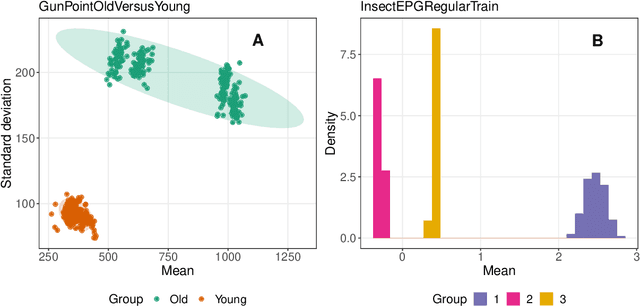
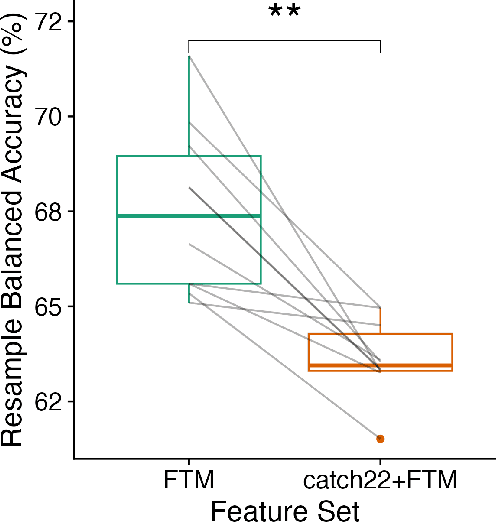
Abstract:The variety of complex algorithmic approaches for tackling time-series classification problems has grown considerably over the past decades, including the development of sophisticated but challenging-to-interpret deep-learning-based methods. But without comparison to simpler methods it can be difficult to determine when such complexity is required to obtain strong performance on a given problem. Here we evaluate the performance of an extremely simple classification approach -- a linear classifier in the space of two simple features that ignore the sequential ordering of the data: the mean and standard deviation of time-series values. Across a large repository of 128 univariate time-series classification problems, this simple distributional moment-based approach outperformed chance on 69 problems, and reached 100% accuracy on two problems. With a neuroimaging time-series case study, we find that a simple linear model based on the mean and standard deviation performs better at classifying individuals with schizophrenia than a model that additionally includes features of the time-series dynamics. Comparing the performance of simple distributional features of a time series provides important context for interpreting the performance of complex time-series classification models, which may not always be required to obtain high accuracy.
Feature-Based Time-Series Analysis in R using the theft Package
Aug 17, 2022
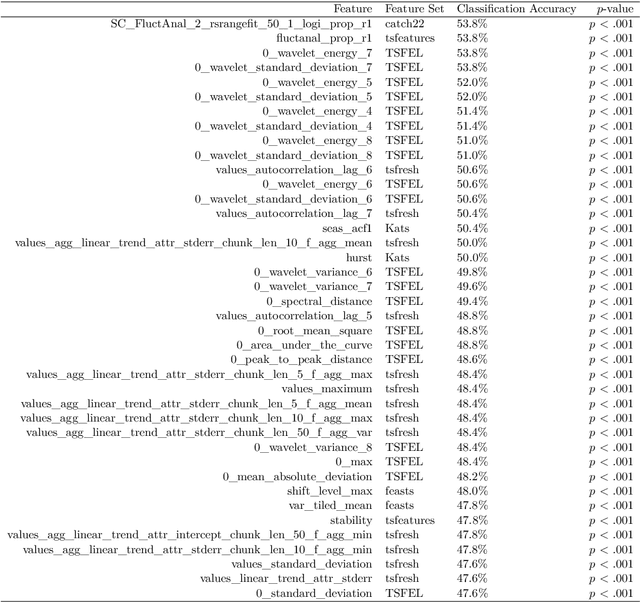
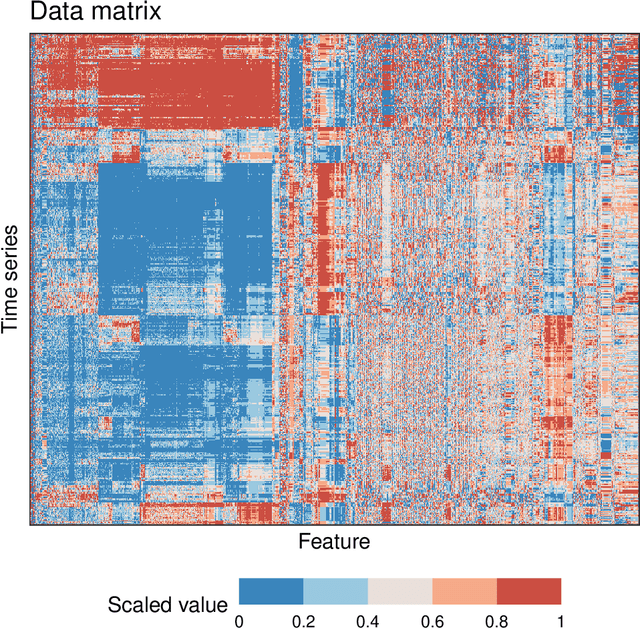
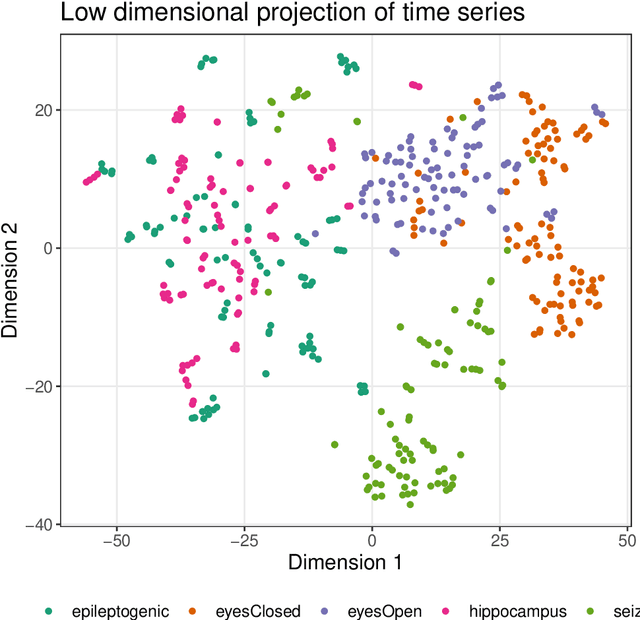
Abstract:Time series are measured and analyzed across the sciences. One method of quantifying the structure of time series is by calculating a set of summary statistics or `features', and then representing a time series in terms of its properties as a feature vector. The resulting feature space is interpretable and informative, and enables conventional statistical learning approaches, including clustering, regression, and classification, to be applied to time-series datasets. Many open-source software packages for computing sets of time-series features exist across multiple programming languages, including catch22 (22 features: Matlab, R, Python, Julia), feasts (42 features: R), tsfeatures (63 features: R), Kats (40 features: Python), tsfresh (779 features: Python), and TSFEL (390 features: Python). However, there are several issues: (i) a singular access point to these packages is not currently available; (ii) to access all feature sets, users must be fluent in multiple languages; and (iii) these feature-extraction packages lack extensive accompanying methodological pipelines for performing feature-based time-series analysis, such as applications to time-series classification. Here we introduce a solution to these issues in an R software package called theft: Tools for Handling Extraction of Features from Time series. theft is a unified and extendable framework for computing features from the six open-source time-series feature sets listed above. It also includes a suite of functions for processing and interpreting the performance of extracted features, including extensive data-visualization templates, low-dimensional projections, and time-series classification operations. With an increasing volume and complexity of time-series datasets in the sciences and industry, theft provides a standardized framework for comprehensively quantifying and interpreting informative structure in time series.
An Empirical Evaluation of Time-Series Feature Sets
Oct 21, 2021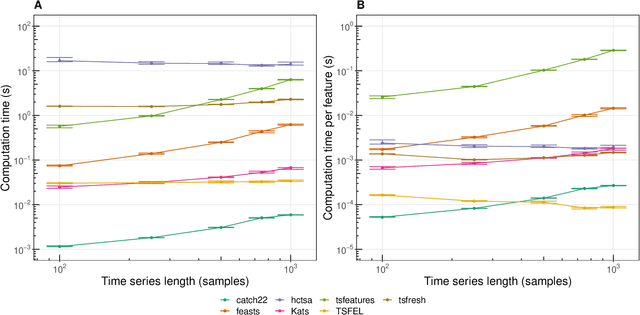

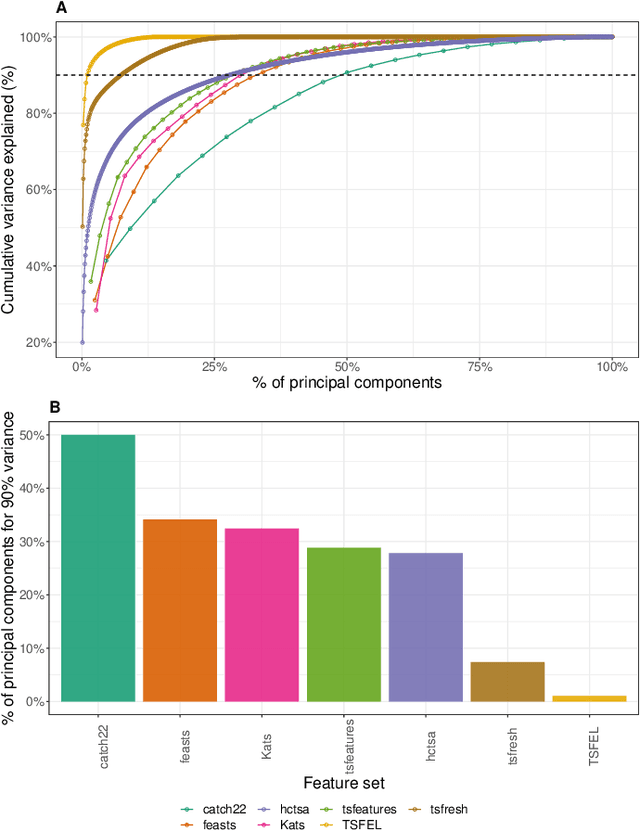

Abstract:Solving time-series problems with features has been rising in popularity due to the availability of software for feature extraction. Feature-based time-series analysis can now be performed using many different feature sets, including hctsa (7730 features: Matlab), feasts (42 features: R), tsfeatures (63 features: R), Kats (40 features: Python), tsfresh (up to 1558 features: Python), TSFEL (390 features: Python), and the C-coded catch22 (22 features: Matlab, R, Python, and Julia). There is substantial overlap in the types of methods included in these sets (e.g., properties of the autocorrelation function and Fourier power spectrum), but they are yet to be systematically compared. Here we compare these seven sets on computational speed, assess the redundancy of features contained in each, and evaluate the overlap and redundancy between them. We take an empirical approach to feature similarity based on outputs across a diverse set of real-world and simulated time series. We find that feature sets vary across three orders of magnitude in their computation time per feature on a laptop for a 1000-sample series, from the fastest sets catch22 and TSFEL (~0.1ms per feature) to tsfeatures (~3s per feature). Using PCA to evaluate feature redundancy within each set, we find the highest within-set redundancy for TSFEL and tsfresh. For example, in TSFEL, 90% of the variance across 390 features can be captured with just four PCs. Finally, we introduce a metric for quantifying overlap between pairs of feature sets, which indicates substantial overlap. We found that the largest feature set, hctsa, is the most comprehensive, and that tsfresh is the most distinctive, due to its incorporation of many low-level Fourier coefficients. Our results provide empirical understanding of the differences between existing feature sets, information that can be used to better tailor feature sets to their applications.
 Add to Chrome
 Add to Firefox
 Add to Edge