Peter Vogel
Evaluating Probabilistic Classifiers: The Triptych
Jan 25, 2023Abstract:Probability forecasts for binary outcomes, often referred to as probabilistic classifiers or confidence scores, are ubiquitous in science and society, and methods for evaluating and comparing them are in great demand. We propose and study a triptych of diagnostic graphics that focus on distinct and complementary aspects of forecast performance: The reliability diagram addresses calibration, the receiver operating characteristic (ROC) curve diagnoses discrimination ability, and the Murphy diagram visualizes overall predictive performance and value. A Murphy curve shows a forecast's mean elementary scores, including the widely used misclassification rate, and the area under a Murphy curve equals the mean Brier score. For a calibrated forecast, the reliability curve lies on the diagonal, and for competing calibrated forecasts, the ROC and Murphy curves share the same number of crossing points. We invoke the recently developed CORP (Consistent, Optimally binned, Reproducible, and Pool-Adjacent-Violators (PAV) algorithm based) approach to craft reliability diagrams and decompose a mean score into miscalibration (MCB), discrimination (DSC), and uncertainty (UNC) components. Plots of the DSC measure of discrimination ability versus the calibration metric MCB visualize classifier performance across multiple competitors. The proposed tools are illustrated in empirical examples from astrophysics, economics, and social science.
Oktoberfest Food Dataset
Nov 22, 2019


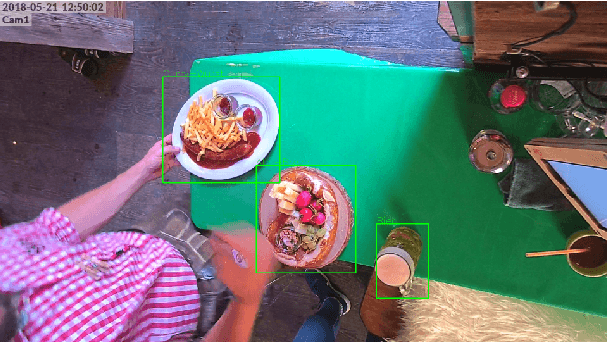
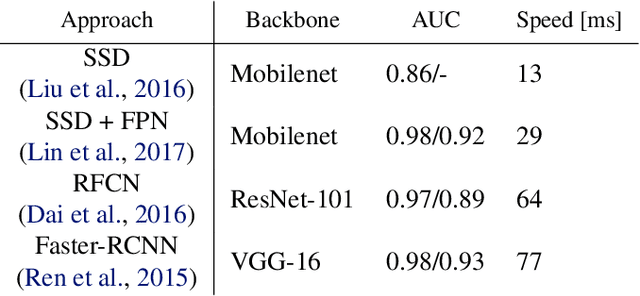
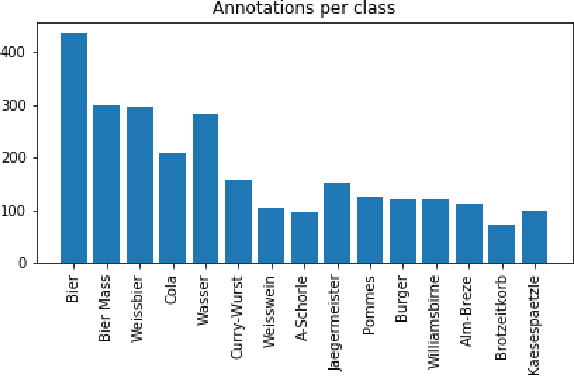
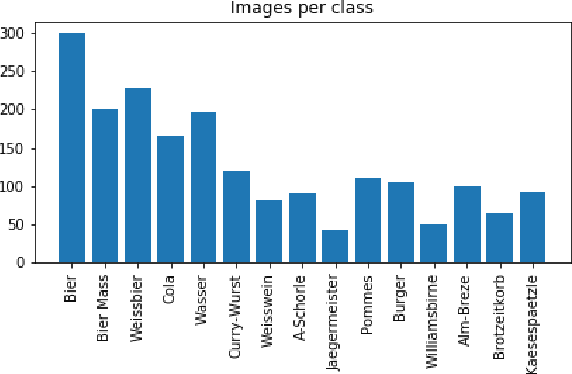
Abstract:We release a realistic, diverse, and challenging dataset for object detection on images. The data was recorded at a beer tent in Germany and consists of 15 different categories of food and drink items. We created more than 2,500 object annotations by hand for 1,110 images captured by a video camera above the checkout. We further make available the remaining 600GB of (unlabeled) data containing days of footage. Additionally, we provide our trained models as a benchmark. Possible applications include automated checkout systems which could significantly speed up the process.
 Add to Chrome
 Add to Firefox
 Add to Edge