Naftali Cohen
Visual Time Series Forecasting: An Image-driven Approach
Jul 02, 2021


Abstract:In this work, we address time-series forecasting as a computer vision task. We capture input data as an image and train a model to produce the subsequent image. This approach results in predicting distributions as opposed to pointwise values. To assess the robustness and quality of our approach, we examine various datasets and multiple evaluation metrics. Our experiments show that our forecasting tool is effective for cyclic data but somewhat less for irregular data such as stock prices. Importantly, when using image-based evaluation metrics, we find our method to outperform various baselines, including ARIMA, and a numerical variation of our deep learning approach.
Visual Forecasting of Time Series with Image-to-Image Regression
Nov 18, 2020


Abstract:Time series forecasting is essential for agents to make decisions in many domains. Existing models rely on classical statistical methods to predict future values based on previously observed numerical information. Yet, practitioners often rely on visualizations such as charts and plots to reason about their predictions. Inspired by the end-users, we re-imagine the topic by creating a framework to produce visual forecasts, similar to the way humans intuitively do. In this work, we take a novel approach by leveraging advances in deep learning to extend the field of time series forecasting to a visual setting. We do this by transforming the numerical analysis problem into the computer vision domain. Using visualizations of time series data as input, we train a convolutional autoencoder to produce corresponding visual forecasts. We examine various synthetic and real datasets with diverse degrees of complexity. Our experiments show that visual forecasting is effective for cyclic data but somewhat less for irregular data such as stock price. Importantly, we find the proposed visual forecasting method to outperform numerical baselines. We attribute the success of the visual forecasting approach to the fact that we convert the continuous numerical regression problem into a discrete domain with quantization of the continuous target signal into pixel space.
The Effect of Visual Design in Image Classification
Aug 20, 2019


Abstract:Financial companies continuously analyze the state of the markets to rethink and adjust their investment strategies. While the analysis is done on the digital form of data, decisions are often made based on graphical representations in white papers or presentation slides. In this study, we examine whether binary decisions are better to be decided based on the numeric or the visual representation of the same data. Using two data sets, a matrix of numerical data with spatial dependencies and financial data describing the state of the S&P index, we compare the results of supervised classification based on the original numerical representation and the visual transformation of the same data. We show that, for these data sets, the visual transformation results in higher predictability skill compared to the original form of the data. We suggest thinking of the visual representation of numeric data, effectively, as a combination of dimensional reduction and feature engineering techniques. In particular, if the visual layout encapsulates the full complexity of the data. In this view, thoughtful visual design can guard against overfitting, or introduce new features -- all of which benefit the learning process, and effectively lead to better recognition of meaningful patterns.
Trading via Image Classification
Jul 23, 2019


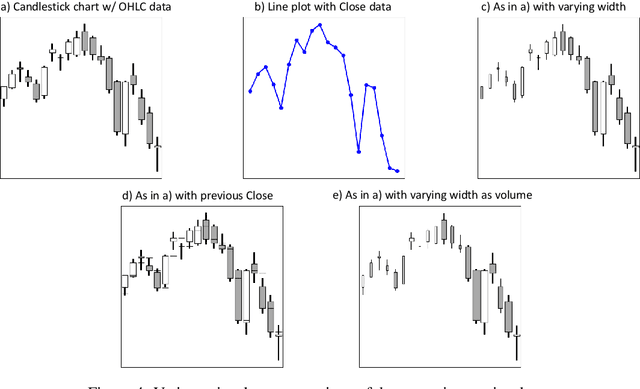
Abstract:The art of systematic financial trading evolved with an array of approaches, ranging from simple strategies to complex algorithms all relying, primary, on aspects of time-series analysis. Recently, after visiting the trading floor of a leading financial institution, we noticed that traders always execute their trade orders while observing images of financial time-series on their screens. In this work, we built upon the success in image recognition and examine the value in transforming the traditional time-series analysis to that of image classification. We create a large sample of financial time-series images encoded as candlestick (Box and Whisker) charts and label the samples following three algebraically-defined binary trade strategies. Using the images, we train over a dozen machine-learning classification models and find that the algorithms are very efficient in recovering the complicated, multiscale label-generating rules when the data is represented visually. We suggest that the transformation of continuous numeric time-series classification problem to a vision problem is useful for recovering signals typical of technical analysis.
 Add to Chrome
 Add to Firefox
 Add to Edge