Milad Asgari Mehrabadi
Department of Computer Science, University of California, Irvine
Novel Blood Pressure Waveform Reconstruction from Photoplethysmography using Cycle Generative Adversarial Networks
Jan 24, 2022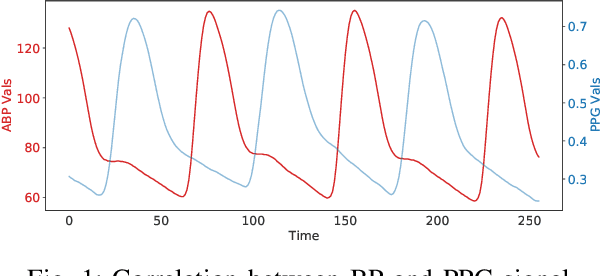
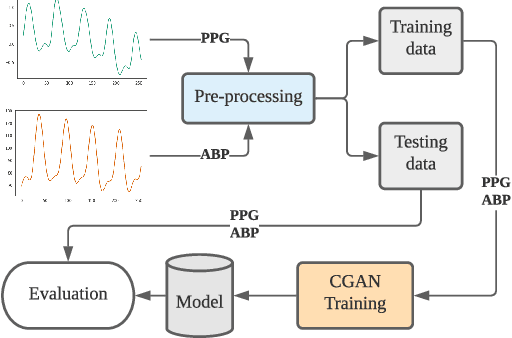
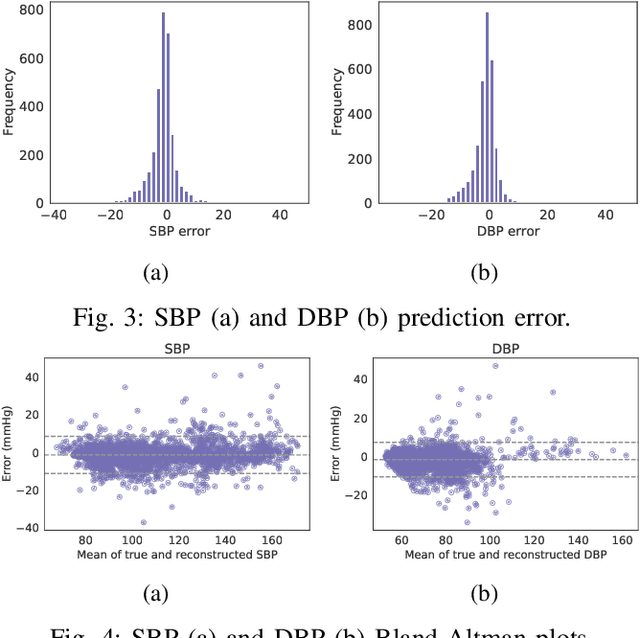
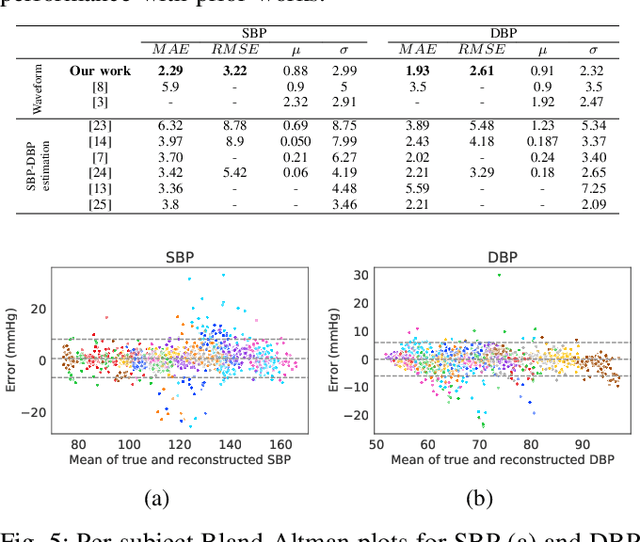
Abstract:Continuous monitoring of blood pressure (BP)can help individuals manage their chronic diseases such as hypertension, requiring non-invasive measurement methods in free-living conditions. Recent approaches fuse Photoplethysmograph (PPG) and electrocardiographic (ECG) signals using different machine and deep learning approaches to non-invasively estimate BP; however, they fail to reconstruct the complete signal, leading to less accurate models. In this paper, we propose a cycle generative adversarial network (CycleGAN) based approach to extract a BP signal known as ambulatory blood pressure (ABP) from a clean PPG signal. Our approach uses a cycle generative adversarial network that extends theGAN architecture for domain translation, and outperforms state-of-the-art approaches by up to 2x in BP estimation.
Detection of COVID-19 Using Heart Rate and Blood Pressure: Lessons Learned from Patients with ARDS
Nov 12, 2020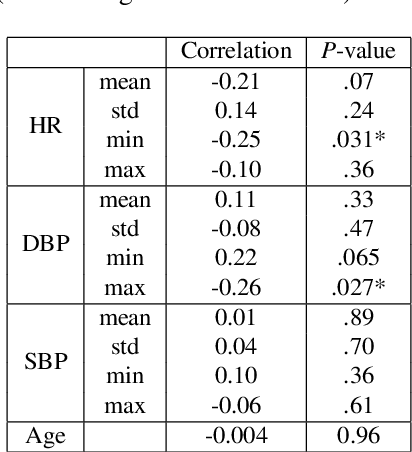
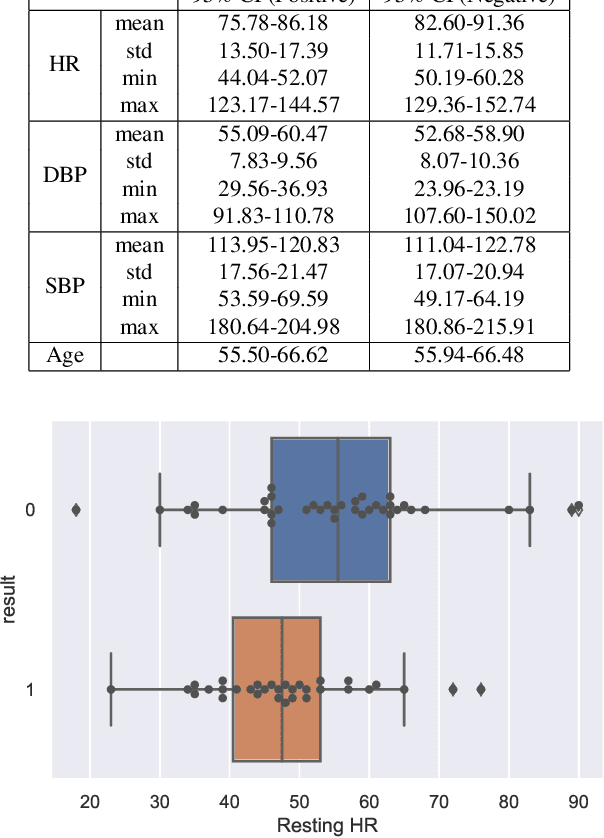
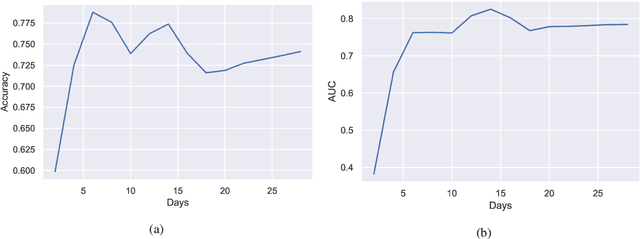
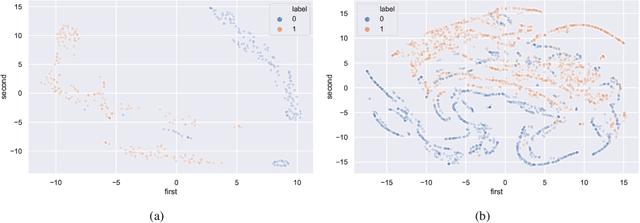
Abstract:The world has been affected by COVID-19 coronavirus. At the time of this study, the number of infected people in the United States is the highest globally (7.9 million infections). Within the infected population, patients diagnosed with acute respiratory distress syndrome (ARDS) are in more life-threatening circumstances, resulting in severe respiratory system failure. Various studies have investigated the infections to COVID-19 and ARDS by monitoring laboratory metrics and symptoms. Unfortunately, these methods are merely limited to clinical settings, and symptom-based methods are shown to be ineffective. In contrast, vital signs (e.g., heart rate) have been utilized to early-detect different respiratory diseases in ubiquitous health monitoring. We posit that such biomarkers are informative in identifying ARDS patients infected with COVID-19. In this study, we investigate the behavior of COVID-19 on ARDS patients by utilizing simple vital signs. We analyze the long-term daily logs of blood pressure and heart rate associated with 70 ARDS patients admitted to five University of California academic health centers (containing 42506 samples for each vital sign) to distinguish subjects with COVID-19 positive and negative test results. In addition to the statistical analysis, we develop a deep neural network model to extract features from the longitudinal data. Using only the first eight days of the data, our deep learning model is able to achieve 78.79% accuracy to classify the vital signs of ARDS patients infected with COVID-19 versus other ARDS diagnosed patients.
The Causality Inference of Public Interest in Restaurants and Bars on COVID-19 Daily Cases in the US: A Google Trends Analysis
Jul 27, 2020
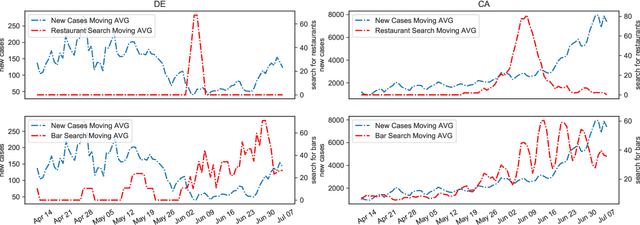
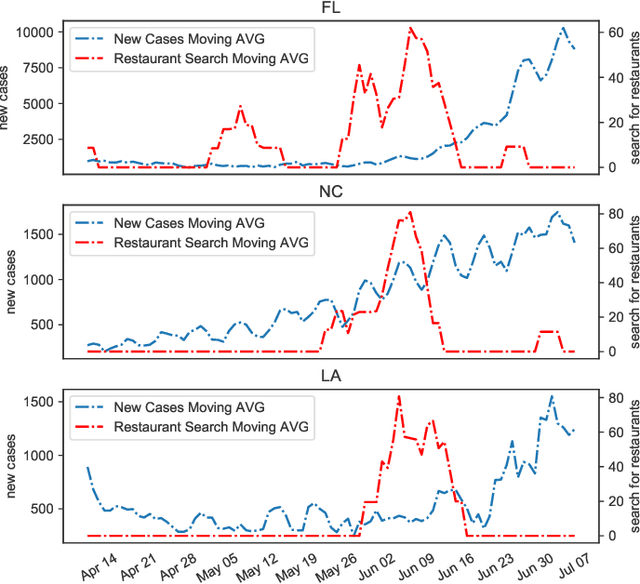

Abstract:The COVID-19 coronavirus pandemic has affected virtually every region of the globe. At the time of conducting this study, the number of daily cases in the United States is more than any other country, and the trend is increasing in most of its states. Google trends provide public interest in various topics during different periods. Analyzing these trends using data mining methods might provide useful insights and observations regarding the COVID-19 outbreak. The objective of this study was to consider the predictive ability of different search terms (i.e., bars and restaurants) with regards to the increase of daily cases in the US. We considered the causation of two different search query trends, namely restaurant and bars, on daily positive cases in top-10 states/territories of the United States with the highest and lowest daily new positive cases. In addition, to measure the linear relation of different trends, we used Pearson correlation. Our results showed for states/territories with higher numbers of daily cases, the historical trends in search queries related to bars and restaurants, which mainly happened after re-opening, significantly affect the daily new cases, on average. California, for example, had most searches for restaurants on June 7th, 2020, which affected the number of new cases within two weeks after the peak with the P-value of .004 for Granger's causality test. Although a limited number of search queries were considered, Google search trends for restaurants and bars showed a significant effect on daily new cases for regions with higher numbers of daily new cases in the United States. We showed that such influential search trends could be used as additional information for prediction tasks in new cases of each region. This prediction can help healthcare leaders manage and control the impact of COVID-19 outbreaks on society and be prepared for the outcomes.
GSR Analysis for Stress: Development and Validation of an Open Source Tool for Noisy Naturalistic GSR Data
May 09, 2020
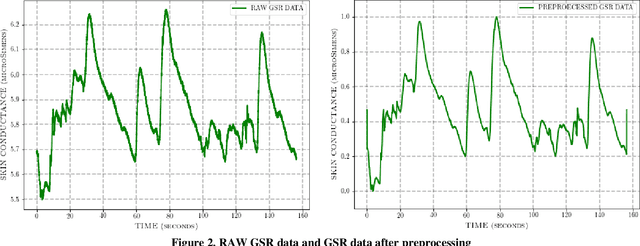
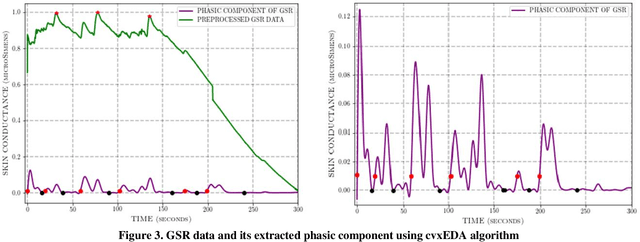
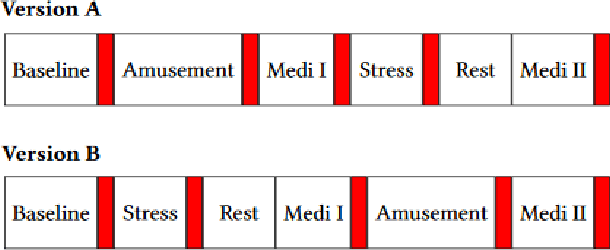
Abstract:The stress detection problem is receiving great attention in related research communities. This is due to its essential part in behavioral studies for many serious health problems and physical illnesses. There are different methods and algorithms for stress detection using different physiological signals. Previous studies have already shown that Galvanic Skin Response (GSR), also known as Electrodermal Activity (EDA), is one of the leading indicators for stress. However, the GSR signal itself is not trivial to analyze. Different features are extracted from GSR signals to detect stress in people like the number of peaks, max peak amplitude, etc. In this paper, we are proposing an open-source tool for GSR analysis, which uses deep learning algorithms alongside statistical algorithms to extract GSR features for stress detection. Then we use different machine learning algorithms and Wearable Stress and Affect Detection (WESAD) dataset to evaluate our results. The results show that we are capable of detecting stress with the accuracy of 92 percent using 10-fold cross-validation and using the features extracted from our tool.
 Add to Chrome
 Add to Firefox
 Add to Edge