Marco Cavallo
DSplats: 3D Generation by Denoising Splats-Based Multiview Diffusion Models
Dec 11, 2024


Abstract:Generating high-quality 3D content requires models capable of learning robust distributions of complex scenes and the real-world objects within them. Recent Gaussian-based 3D reconstruction techniques have achieved impressive results in recovering high-fidelity 3D assets from sparse input images by predicting 3D Gaussians in a feed-forward manner. However, these techniques often lack the extensive priors and expressiveness offered by Diffusion Models. On the other hand, 2D Diffusion Models, which have been successfully applied to denoise multiview images, show potential for generating a wide range of photorealistic 3D outputs but still fall short on explicit 3D priors and consistency. In this work, we aim to bridge these two approaches by introducing DSplats, a novel method that directly denoises multiview images using Gaussian Splat-based Reconstructors to produce a diverse array of realistic 3D assets. To harness the extensive priors of 2D Diffusion Models, we incorporate a pretrained Latent Diffusion Model into the reconstructor backbone to predict a set of 3D Gaussians. Additionally, the explicit 3D representation embedded in the denoising network provides a strong inductive bias, ensuring geometrically consistent novel view generation. Our qualitative and quantitative experiments demonstrate that DSplats not only produces high-quality, spatially consistent outputs, but also sets a new standard in single-image to 3D reconstruction. When evaluated on the Google Scanned Objects dataset, DSplats achieves a PSNR of 20.38, an SSIM of 0.842, and an LPIPS of 0.109.
A Visual Interaction Framework for Dimensionality Reduction Based Data Exploration
Nov 28, 2018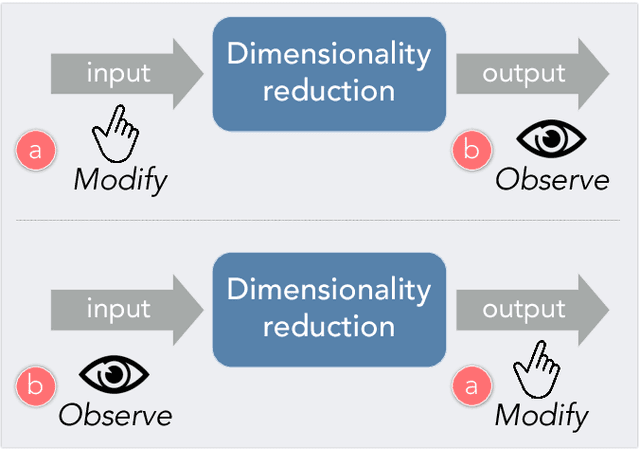

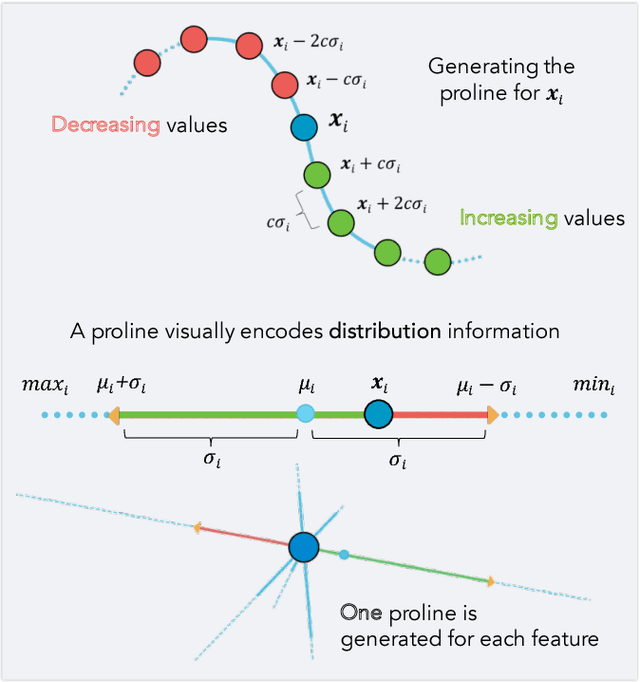

Abstract:Dimensionality reduction is a common method for analyzing and visualizing high-dimensional data. However, reasoning dynamically about the results of a dimensionality reduction is difficult. Dimensionality-reduction algorithms use complex optimizations to reduce the number of dimensions of a dataset, but these new dimensions often lack a clear relation to the initial data dimensions, thus making them difficult to interpret. Here we propose a visual interaction framework to improve dimensionality-reduction based exploratory data analysis. We introduce two interaction techniques, forward projection and backward projection, for dynamically reasoning about dimensionally reduced data. We also contribute two visualization techniques, prolines and feasibility maps, to facilitate the effective use of the proposed interactions. We apply our framework to PCA and autoencoder-based dimensionality reductions. Through data-exploration examples, we demonstrate how our visual interactions can improve the use of dimensionality reduction in exploratory data analysis.
Clustrophile 2: Guided Visual Clustering Analysis
Sep 08, 2018
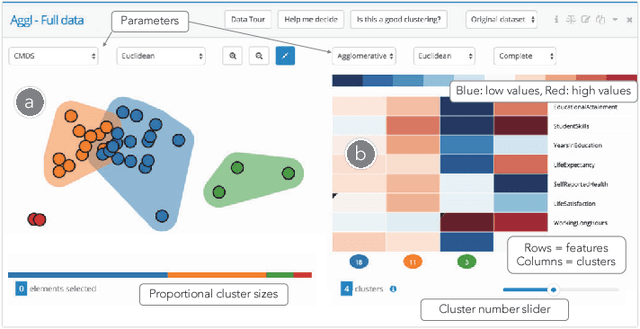
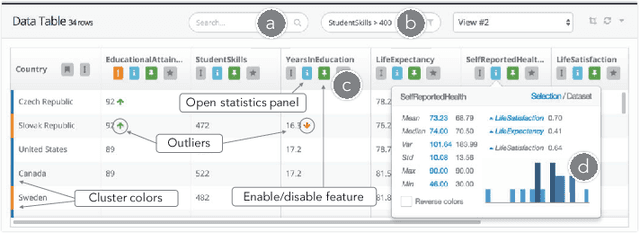
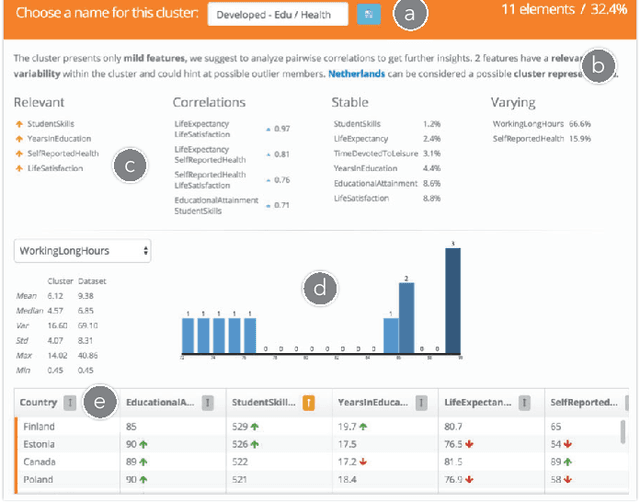
Abstract:Data clustering is a common unsupervised learning method frequently used in exploratory data analysis. However, identifying relevant structures in unlabeled, high-dimensional data is nontrivial, requiring iterative experimentation with clustering parameters as well as data features and instances. The number of possible clusterings for a typical dataset is vast, and navigating in this vast space is also challenging. The absence of ground-truth labels makes it impossible to define an optimal solution, thus requiring user judgment to establish what can be considered a satisfiable clustering result. Data scientists need adequate interactive tools to effectively explore and navigate the large clustering space so as to improve the effectiveness of exploratory clustering analysis. We introduce \textit{Clustrophile~2}, a new interactive tool for guided clustering analysis. \textit{Clustrophile~2} guides users in clustering-based exploratory analysis, adapts user feedback to improve user guidance, facilitates the interpretation of clusters, and helps quickly reason about differences between clusterings. To this end, \textit{Clustrophile~2} contributes a novel feature, the Clustering Tour, to help users choose clustering parameters and assess the quality of different clustering results in relation to current analysis goals and user expectations. We evaluate \textit{Clustrophile~2} through a user study with 12 data scientists, who used our tool to explore and interpret sub-cohorts in a dataset of Parkinson's disease patients. Results suggest that \textit{Clustrophile~2} improves the speed and effectiveness of exploratory clustering analysis for both experts and non-experts.
Track Xplorer: A System for Visual Analysis of Sensor-based Motor Activity Predictions
Jun 25, 2018


Abstract:With the rapid commoditization of wearable sensors, detecting human movements from sensor datasets has become increasingly common over a wide range of applications. To detect activities, data scientists iteratively experiment with different classifiers before deciding which model to deploy. Effective reasoning about and comparison of alternative classifiers are crucial in successful model development. This is, however, inherently difficult in developing classifiers for sensor data, where the intricacy of long temporal sequences, high prediction frequency, and imprecise labeling make standard evaluation methods relatively ineffective and even misleading. We introduce Track Xplorer, an interactive visualization system to query, analyze, and compare the predictions of sensor-data classifiers. Track Xplorer enables users to interactively explore and compare the results of different classifiers, and assess their accuracy with respect to the ground-truth labels and video. Through integration with a version control system, Track Xplorer supports tracking of models and their parameters without additional workload on model developers. Track Xplorer also contributes an extensible algebra over track representations to filter, compose, and compare classification outputs, enabling users to reason effectively about classifier performance. We apply Track Xplorer in a collaborative project to develop classifiers to detect movements from multisensor data gathered from Parkinson's disease patients. We demonstrate how Track Xplorer helps identify early on possible systemic data errors, effectively track and compare the results of different classifiers, and reason about and pinpoint the causes of misclassifications.
 Add to Chrome
 Add to Firefox
 Add to Edge