Clustrophile 2: Guided Visual Clustering Analysis
Paper and Code
Sep 08, 2018


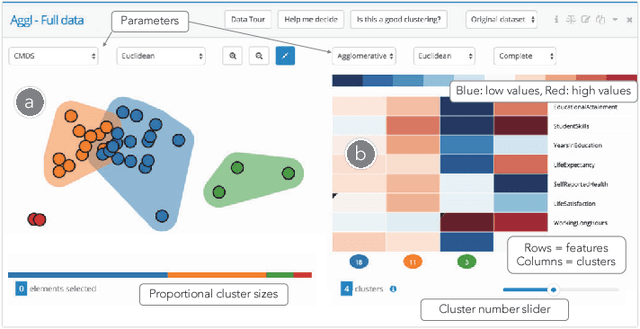
Data clustering is a common unsupervised learning method frequently used in exploratory data analysis. However, identifying relevant structures in unlabeled, high-dimensional data is nontrivial, requiring iterative experimentation with clustering parameters as well as data features and instances. The number of possible clusterings for a typical dataset is vast, and navigating in this vast space is also challenging. The absence of ground-truth labels makes it impossible to define an optimal solution, thus requiring user judgment to establish what can be considered a satisfiable clustering result. Data scientists need adequate interactive tools to effectively explore and navigate the large clustering space so as to improve the effectiveness of exploratory clustering analysis. We introduce \textit{Clustrophile~2}, a new interactive tool for guided clustering analysis. \textit{Clustrophile~2} guides users in clustering-based exploratory analysis, adapts user feedback to improve user guidance, facilitates the interpretation of clusters, and helps quickly reason about differences between clusterings. To this end, \textit{Clustrophile~2} contributes a novel feature, the Clustering Tour, to help users choose clustering parameters and assess the quality of different clustering results in relation to current analysis goals and user expectations. We evaluate \textit{Clustrophile~2} through a user study with 12 data scientists, who used our tool to explore and interpret sub-cohorts in a dataset of Parkinson's disease patients. Results suggest that \textit{Clustrophile~2} improves the speed and effectiveness of exploratory clustering analysis for both experts and non-experts.
 Add to Chrome
 Add to Firefox
 Add to Edge