Jianping Kelvin Li
P6: A Declarative Language for Integrating Machine Learning in Visual Analytics
Sep 03, 2020Abstract:We present P6, a declarative language for building high performance visual analytics systems through its support for specifying and integrating machine learning and interactive visualization methods. As data analysis methods based on machine learning and artificial intelligence continue to advance, a visual analytics solution can leverage these methods for better exploiting large and complex data. However, integrating machine learning methods with interactive visual analysis is challenging. Existing declarative programming libraries and toolkits for visualization lack support for coupling machine learning methods. By providing a declarative language for visual analytics, P6 can empower more developers to create visual analytics applications that combine machine learning and visualization methods for data analysis and problem solving. Through a variety of example applications, we demonstrate P6's capabilities and show the benefits of using declarative specifications to build visual analytics systems. We also identify and discuss the research opportunities and challenges for declarative visual analytics.
A Visual Analytics Framework for Reviewing Streaming Performance Data
Jan 26, 2020


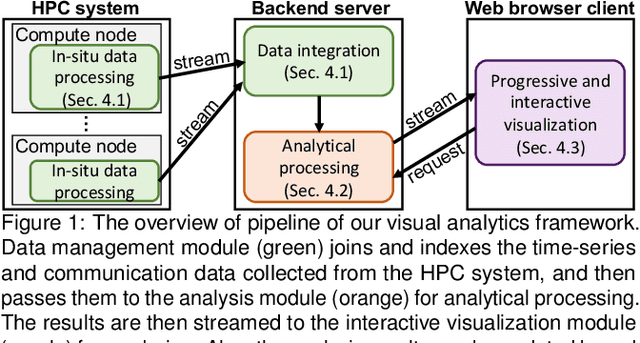
Abstract:Understanding and tuning the performance of extreme-scale parallel computing systems demands a streaming approach due to the computational cost of applying offline algorithms to vast amounts of performance log data. Analyzing large streaming data is challenging because the rate of receiving data and limited time to comprehend data make it difficult for the analysts to sufficiently examine the data without missing important changes or patterns. To support streaming data analysis, we introduce a visual analytic framework comprising of three modules: data management, analysis, and interactive visualization. The data management module collects various computing and communication performance metrics from the monitored system using streaming data processing techniques and feeds the data to the other two modules. The analysis module automatically identifies important changes and patterns at the required latency. In particular, we introduce a set of online and progressive analysis methods for not only controlling the computational costs but also helping analysts better follow the critical aspects of the analysis results. Finally, the interactive visualization module provides the analysts with a coherent view of the changes and patterns in the continuously captured performance data. Through a multi-faceted case study on performance analysis of parallel discrete-event simulation, we demonstrate the effectiveness of our framework for identifying bottlenecks and locating outliers.
 Add to Chrome
 Add to Firefox
 Add to Edge