Javier Borge-Holthoefer
Predicting the impact of urban change in pedestrian and road safety
Feb 03, 2022


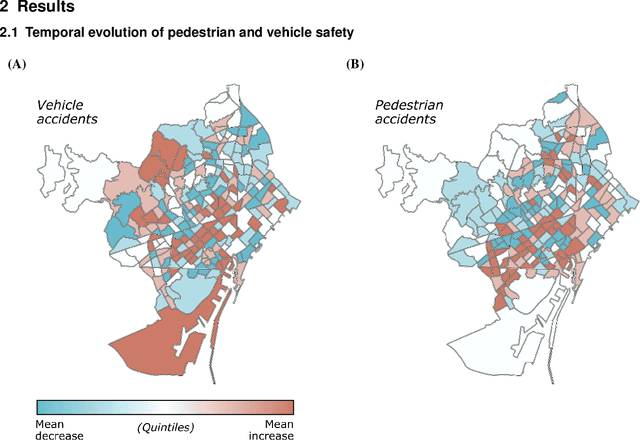
Abstract:Increased interaction between and among pedestrians and vehicles in the crowded urban environments of today gives rise to a negative side-effect: a growth in traffic accidents, with pedestrians being the most vulnerable elements. Recent work has shown that Convolutional Neural Networks are able to accurately predict accident rates exploiting Street View imagery along urban roads. The promising results point to the plausibility of aided design of safe urban landscapes, for both pedestrians and vehicles. In this paper, by considering historical accident data and Street View images, we detail how to automatically predict the impact (increase or decrease) of urban interventions on accident incidence. The results are positive, rendering an accuracies ranging from 60 to 80%. We additionally provide an interpretability analysis to unveil which specific categories of urban features impact accident rates positively or negatively. Considering the transportation network substrates (sidewalk and road networks) and their demand, we integrate these results to a complex network framework, to estimate the effective impact of urban change on the safety of pedestrians and vehicles. Results show that public authorities may leverage on machine learning tools to prioritize targeted interventions, since our analysis show that limited improvement is obtained with current tools. Further, our findings have a wider application range such as the design of safe urban routes for pedestrians or to the field of driver-assistance technologies.
Explainable, automated urban interventions to improve pedestrian and vehicle safety
Nov 08, 2021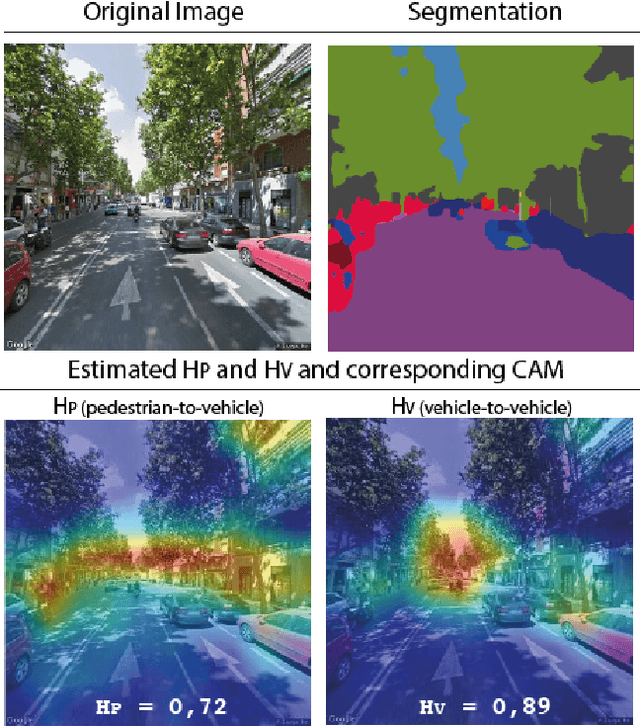
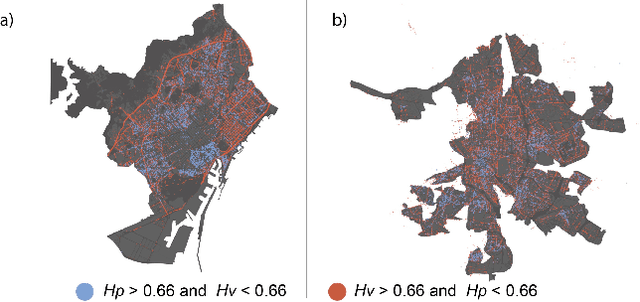
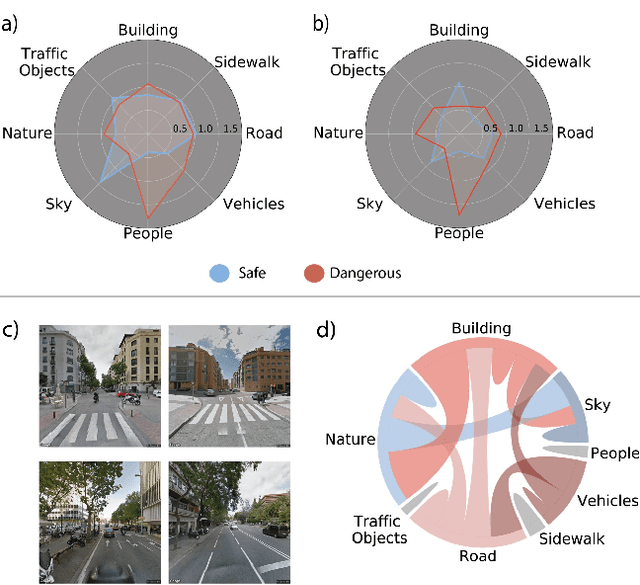
Abstract:At the moment, urban mobility research and governmental initiatives are mostly focused on motor-related issues, e.g. the problems of congestion and pollution. And yet, we can not disregard the most vulnerable elements in the urban landscape: pedestrians, exposed to higher risks than other road users. Indeed, safe, accessible, and sustainable transport systems in cities are a core target of the UN's 2030 Agenda. Thus, there is an opportunity to apply advanced computational tools to the problem of traffic safety, in regards especially to pedestrians, who have been often overlooked in the past. This paper combines public data sources, large-scale street imagery and computer vision techniques to approach pedestrian and vehicle safety with an automated, relatively simple, and universally-applicable data-processing scheme. The steps involved in this pipeline include the adaptation and training of a Residual Convolutional Neural Network to determine a hazard index for each given urban scene, as well as an interpretability analysis based on image segmentation and class activation mapping on those same images. Combined, the outcome of this computational approach is a fine-grained map of hazard levels across a city, and an heuristic to identify interventions that might simultaneously improve pedestrian and vehicle safety. The proposed framework should be taken as a complement to the work of urban planners and public authorities.
Predicting Driver Self-Reported Stress by Analyzing the Road Scene
Sep 27, 2021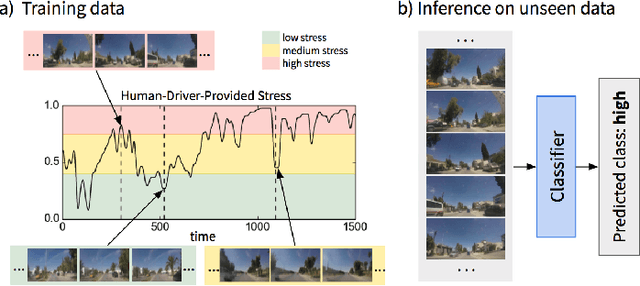
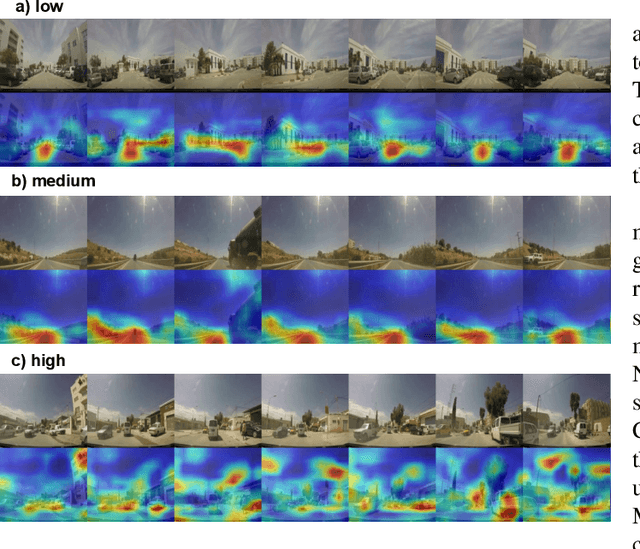

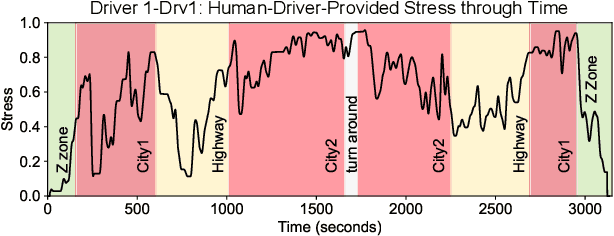
Abstract:Several studies have shown the relevance of biosignals in driver stress recognition. In this work, we examine something important that has been less frequently explored: We develop methods to test if the visual driving scene can be used to estimate a drivers' subjective stress levels. For this purpose, we use the AffectiveROAD video recordings and their corresponding stress labels, a continuous human-driver-provided stress metric. We use the common class discretization for stress, dividing its continuous values into three classes: low, medium, and high. We design and evaluate three computer vision modeling approaches to classify the driver's stress levels: (1) object presence features, where features are computed using automatic scene segmentation; (2) end-to-end image classification; and (3) end-to-end video classification. All three approaches show promising results, suggesting that it is possible to approximate the drivers' subjective stress from the information found in the visual scene. We observe that the video classification, which processes the temporal information integrated with the visual information, obtains the highest accuracy of $0.72$, compared to a random baseline accuracy of $0.33$ when tested on a set of nine drivers.
 Add to Chrome
 Add to Firefox
 Add to Edge