Holger Stitz
Exploring Visual Patterns in Projected Human and Machine Decision-Making Paths
Jan 20, 2020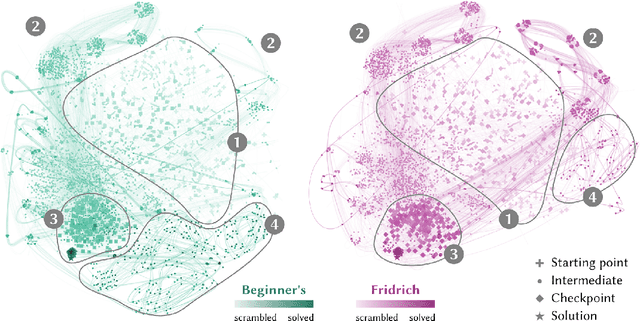
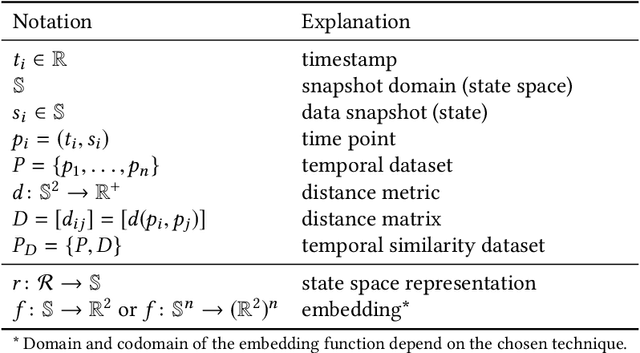
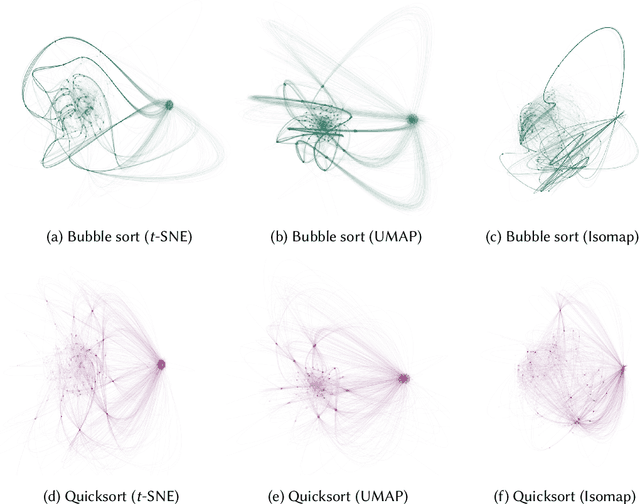
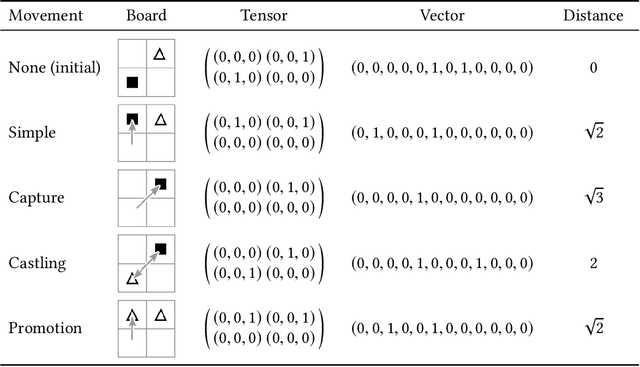
Abstract:In problem solving, the paths towards solutions can be viewed as a sequence of decisions. The decisions, made by humans or computers, describe a trajectory through a high-dimensional representation space of the problem. Using dimensionality reduction, these trajectories can be visualized in lower dimensional space. Such embedded trajectories have previously been applied to a wide variety of data, but so far, almost exclusively the self-similarity of single trajectories has been analyzed. In contrast, we describe patterns emerging from drawing many trajectories---for different initial conditions, end states, or solution strategies---in the same embedding space. We argue that general statements about the problem solving tasks and solving strategies can be made by interpreting these patterns. We explore and characterize such patterns in trajectories resulting from human and machine-made decisions in a variety of application domains: logic puzzles (Rubik's cube), strategy games (chess), and optimization problems (neural network training). In the context of Rubik's cube, we present a physical interactive demonstrator that uses trajectory visualization to provide immediate feedback to users regarding the consequences of their decisions. We also discuss the importance of suitably chosen representation spaces and similarity metrics for the embedding.
ConfusionFlow: A model-agnostic visualization for temporal analysis of classifier confusion
Oct 02, 2019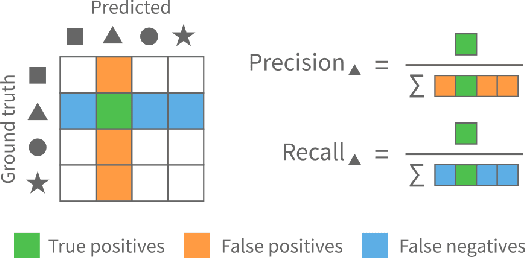
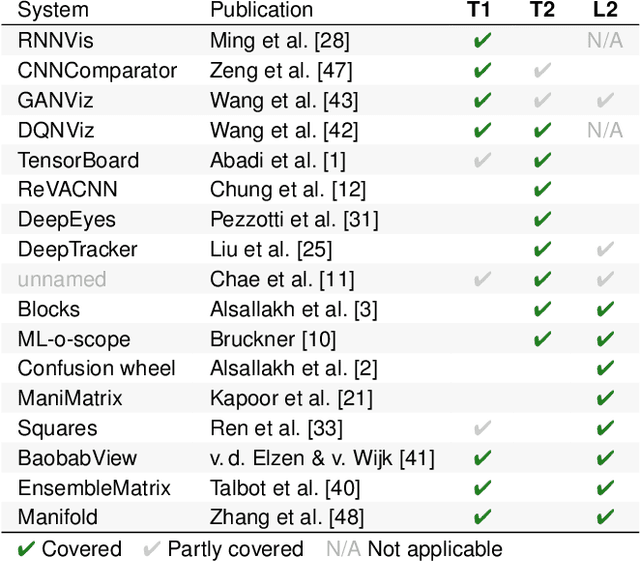
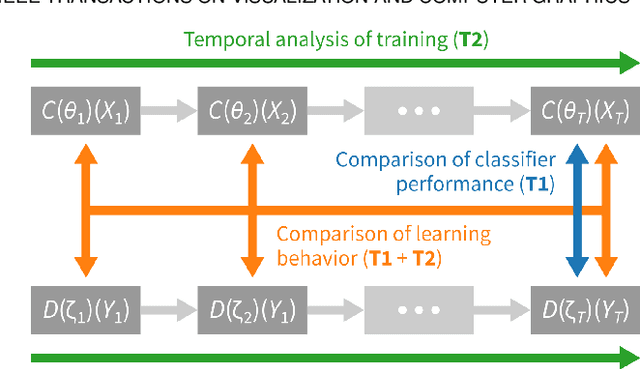

Abstract:Classifiers are among the most widely used supervised machine learning algorithms. Many classification models exist, and choosing the right one for a given task is difficult. During model selection and debugging, data scientists need to asses classifier performance, evaluate the training behavior over time, and compare different models. Typically, this analysis is based on single-number performance measures such as accuracy. A more detailed evaluation of classifiers is possible by inspecting class errors. The confusion matrix is an established way for visualizing these class errors, but it was not designed with temporal or comparative analysis in mind. More generally, established performance analysis systems do not allow a combined temporal and comparative analysis of class-level information. To address this issue, we propose ConfusionFlow, an interactive, comparative visualization tool that combines the benefits of class confusion matrices with the visualization of performance characteristics over time. ConfusionFlow is model-agnostic and can be used to compare performances for different model types, model architectures, and/or training and test datasets. We demonstrate the usefulness of ConfusionFlow in the context of two practical problems: an analysis of the influence of network pruning on model errors, and a case study on instance selection strategies in active learning.
 Add to Chrome
 Add to Firefox
 Add to Edge