Heitor S. Ramos
Statistical Properties of the Entropy from Ordinal Patterns
Sep 15, 2022Abstract:The ultimate purpose of the statistical analysis of ordinal patterns is to characterize the distribution of the features they induce. In particular, knowing the joint distribution of the pair Entropy-Statistical Complexity for a large class of time series models would allow statistical tests that are unavailable to date. Working in this direction, we characterize the asymptotic distribution of the empirical Shannon's Entropy for any model under which the true normalized Entropy is neither zero nor one. We obtain the asymptotic distribution from the Central Limit Theorem (assuming large time series), the Multivariate Delta Method, and a third-order correction of its mean value. We discuss the applicability of other results (exact, first-, and second-order corrections) regarding their accuracy and numerical stability. Within a general framework for building test statistics about Shannon's Entropy, we present a bilateral test that verifies if there is enough evidence to reject the hypothesis that two signals produce ordinal patterns with the same Shannon's Entropy. We applied this bilateral test to the daily maximum temperature time series from three cities (Dublin, Edinburgh, and Miami) and obtained sensible results.
A New Similarity Space Tailored for Supervised Deep Metric Learning
Nov 18, 2020


Abstract:We propose a novel deep metric learning method. Differently from many works on this area, we defined a novel latent space obtained through an autoencoder. The new space, namely S-space, is divided into different regions that describe the positions where pairs of objects are similar/dissimilar. We locate makers to identify these regions. We estimate the similarities between objects through a kernel-based t-student distribution to measure the markers' distance and the new data representation. In our approach, we simultaneously estimate the markers' position in the S-space and represent the objects in the same space. Moreover, we propose a new regularization function to avoid similar markers to collapse altogether. We present evidences that our proposal can represent complex spaces, for instance, when groups of similar objects are located in disjoint regions. We compare our proposal to 9 different distance metric learning approaches (four of them are based on deep-learning) on 28 real-world heterogeneous datasets. According to the four quantitative metrics used, our method overcomes all the nine strategies from the literature.
Speckle Reduction with Adaptive Stack Filters
Jun 08, 2013


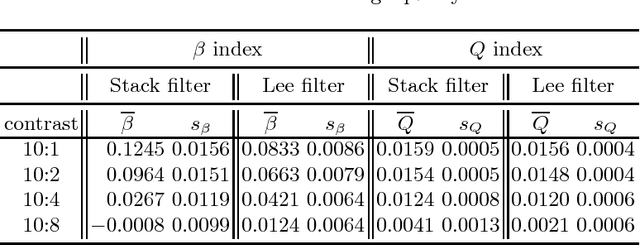
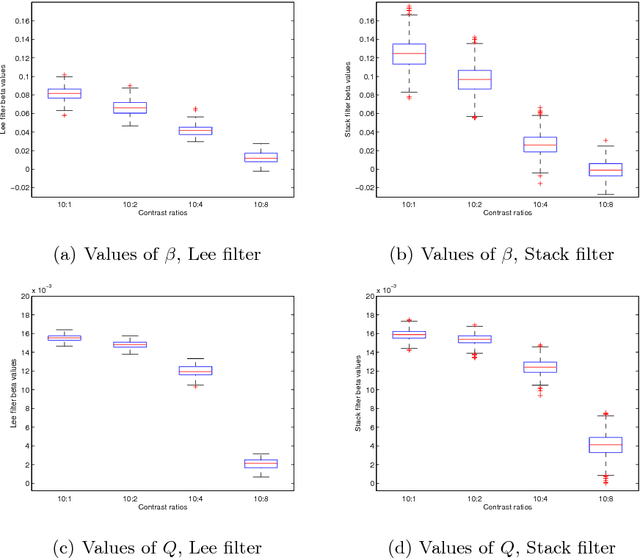
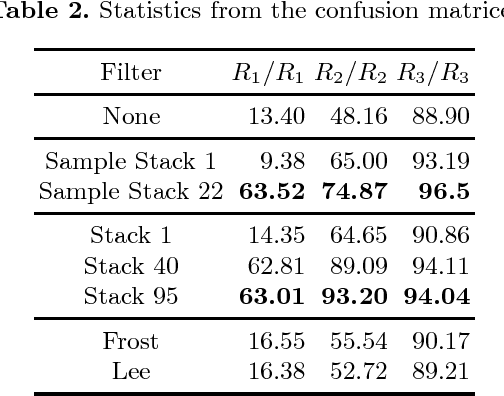
Abstract:Stack filters are a special case of non-linear filters. They have a good performance for filtering images with different types of noise while preserving edges and details. A stack filter decomposes an input image into stacks of binary images according to a set of thresholds. Each binary image is then filtered by a Boolean function, which characterizes the filter. Adaptive stack filters can be computed by training using a prototype (ideal) image and its corrupted version, leading to optimized filters with respect to a loss function. In this work we propose the use of training with selected samples for the estimation of the optimal Boolean function. We study the performance of adaptive stack filters when they are applied to speckled imagery, in particular to Synthetic Aperture Radar (SAR) images. This is done by evaluating the quality of the filtered images through the use of suitable image quality indexes and by measuring the classification accuracy of the resulting images. We used SAR images as input, since they are affected by speckle noise that makes classification a difficult task.
Assessment of SAR Image Filtering using Adaptive Stack Filters
Jul 18, 2012


Abstract:Stack filters are a special case of non-linear filters. They have a good performance for filtering images with different types of noise while preserving edges and details. A stack filter decomposes an input image into several binary images according to a set of thresholds. Each binary image is then filtered by a Boolean function, which characterizes the filter. Adaptive stack filters can be designed to be optimal; they are computed from a pair of images consisting of an ideal noiseless image and its noisy version. In this work we study the performance of adaptive stack filters when they are applied to Synthetic Aperture Radar (SAR) images. This is done by evaluating the quality of the filtered images through the use of suitable image quality indexes and by measuring the classification accuracy of the resulting images.
 Add to Chrome
 Add to Firefox
 Add to Edge