Hamdi Kavak
Extracting the U.S. building types from OpenStreetMap data
Sep 09, 2024


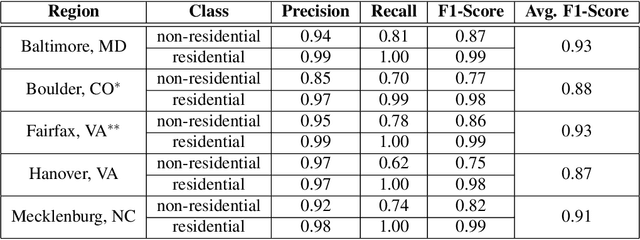
Abstract:Building type information is crucial for population estimation, traffic planning, urban planning, and emergency response applications. Although essential, such data is often not readily available. To alleviate this problem, this work creates a comprehensive dataset by providing residential/non-residential building classification covering the entire United States. We propose and utilize an unsupervised machine learning method to classify building types based on building footprints and available OpenStreetMap information. The classification result is validated using authoritative ground truth data for select counties in the U.S. The validation shows a high precision for non-residential building classification and a high recall for residential buildings. We identified various approaches to improving the quality of the classification, such as removing sheds and garages from the dataset. Furthermore, analyzing the misclassifications revealed that they are mainly due to missing and scarce metadata in OSM. A major result of this work is the resulting dataset of classifying 67,705,475 buildings. We hope that this data is of value to the scientific community, including urban and transportation planners.
Change of human mobility during COVID-19: A United States case study
Sep 18, 2021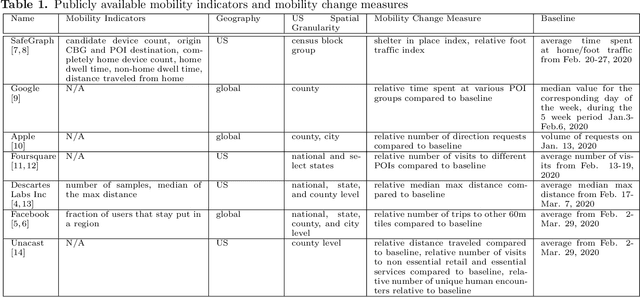
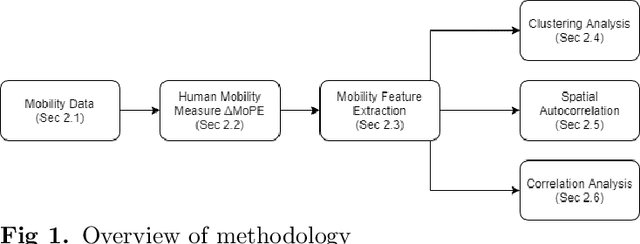
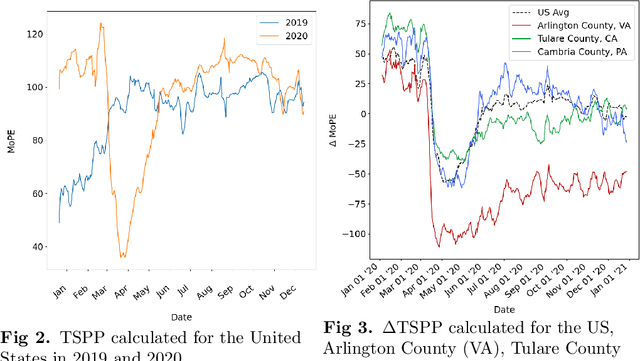
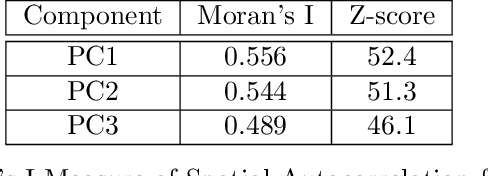
Abstract:With the onset of COVID-19 and the resulting shelter in place guidelines combined with remote working practices, human mobility in 2020 has been dramatically impacted. Existing studies typically examine whether mobility in specific localities increases or decreases at specific points in time and relate these changes to certain pandemic and policy events. In this paper, we study mobility change in the US through a five-step process using mobility footprint data. (Step 1) Propose the delta Time Spent in Public Places (Delta-TSPP) as a measure to quantify daily changes in mobility for each US county from 2019-2020. (Step 2) Conduct Principal Component Analysis (PCA) to reduce the Delta-TSPP time series of each county to lower-dimensional latent components of change in mobility. (Step 3) Conduct clustering analysis to find counties that exhibit similar latent components. (Step 4) Investigate local and global spatial autocorrelation for each component. (Step 5) Conduct correlation analysis to investigate how various population characteristics and behavior correlate with mobility patterns. Results show that by describing each county as a linear combination of the three latent components, we can explain 59% of the variation in mobility trends across all US counties. Specifically, change in mobility in 2020 for US counties can be explained as a combination of three latent components: 1) long-term reduction in mobility, 2) no change in mobility, and 3) short-term reduction in mobility. We observe significant correlations between the three latent components of mobility change and various population characteristics, including political leaning, population, COVID-19 cases and deaths, and unemployment. We find that our analysis provides a comprehensive understanding of mobility change in response to the COVID-19 pandemic.
 Add to Chrome
 Add to Firefox
 Add to Edge