Gaurav Dixit
Contrastive Identification of Covariate Shift in Image Data
Aug 19, 2021


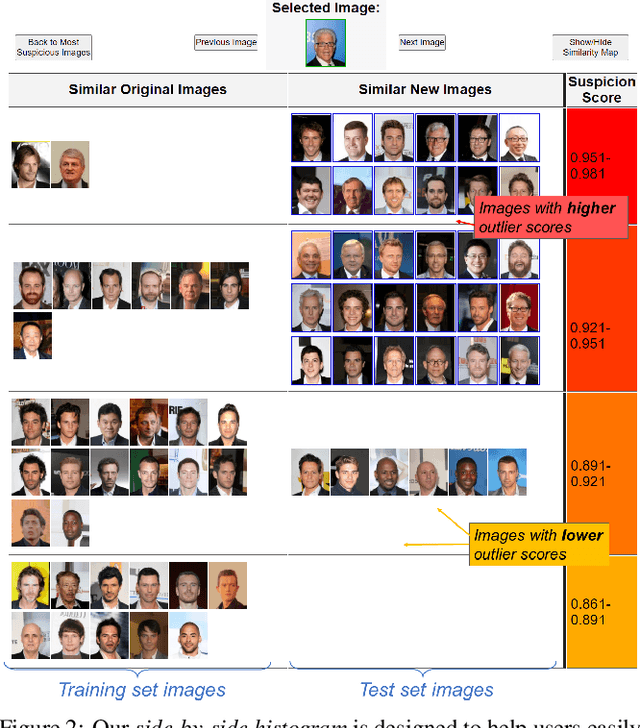
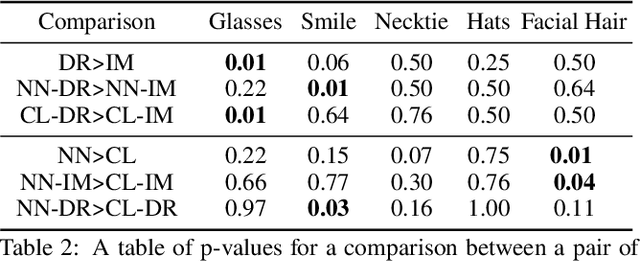
Abstract:Identifying covariate shift is crucial for making machine learning systems robust in the real world and for detecting training data biases that are not reflected in test data. However, detecting covariate shift is challenging, especially when the data consists of high-dimensional images, and when multiple types of localized covariate shift affect different subspaces of the data. Although automated techniques can be used to detect the existence of covariate shift, our goal is to help human users characterize the extent of covariate shift in large image datasets with interfaces that seamlessly integrate information obtained from the detection algorithms. In this paper, we design and evaluate a new visual interface that facilitates the comparison of the local distributions of training and test data. We conduct a quantitative user study on multi-attribute facial data to compare two different learned low-dimensional latent representations (pretrained ImageNet CNN vs. density ratio) and two user analytic workflows (nearest-neighbor vs. cluster-to-cluster). Our results indicate that the latent representation of our density ratio model, combined with a nearest-neighbor comparison, is the most effective at helping humans identify covariate shift.
 Add to Chrome
 Add to Firefox
 Add to Edge