David Gómez-Ullate
How do tuna schools associate to dFADs? A study using echo-sounder buoys to identify global patterns
Jul 14, 2022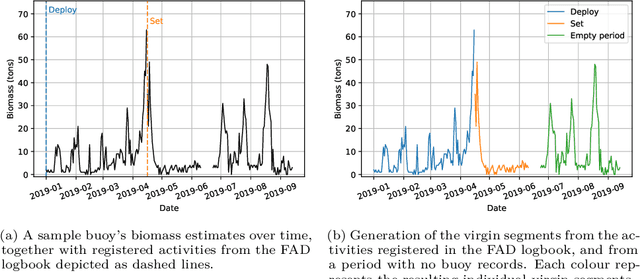
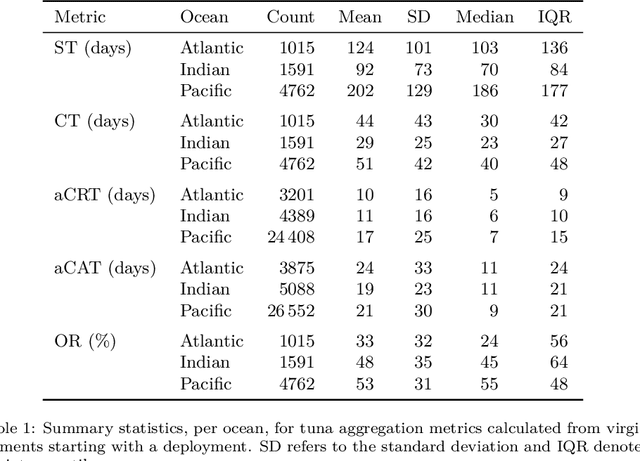


Abstract:Based on the data gathered by echo-sounder buoys attached to drifting Fish Aggregating Devices (dFADs) across tropical oceans, the current study applies a Machine Learning protocol to examine the temporal trends of tuna schools' association to drifting objects. Using a binary output, metrics typically used in the literature were adapted to account for the fact that the entire tuna aggregation under the dFAD was considered. The median time it took tuna to colonize the dFADs for the first time varied between 25 and 43 days, depending on the ocean, and the longest soak and colonization times were registered in the Pacific Ocean. The tuna schools' Continuous Residence Times were generally shorter than Continuous Absence Times (median values between 5 and 7 days, and 9 and 11 days, respectively), in line with the results found by previous studies. Using a regression output, two novel metrics, namely aggregation time and disaggregation time, were estimated to obtain further insight into the symmetry of the aggregation process. Across all oceans, the time it took for the tuna aggregation to depart from the dFADs was not significantly longer than the time it took for the aggregation to form. The value of these results in the context of the "ecological trap" hypothesis is discussed, and further analyses to enrich and make use of this data source are proposed.
Tuna-AI: tuna biomass estimation with Machine Learning models trained on oceanography and echosounder FAD data
Sep 29, 2021Abstract:Echo-sounder data registered by buoys attached to drifting FADs provide a very valuable source of information on populations of tuna and their behaviour. This value increases whenthese data are supplemented with oceanographic data coming from CMEMS. We use these sources to develop Tuna-AI, a Machine Learning model aimed at predicting tuna biomass under a given buoy, which uses a 3-day window of echo-sounder data to capture the daily spatio-temporal patterns characteristic of tuna schools. As the supervised signal for training, we employ more than 5000 set events with their corresponding tuna catch reported by the AGAC tuna purse seine fleet.
NILM as a regression versus classification problem: the importance of thresholding
Oct 28, 2020


Abstract:Non-Intrusive Load Monitoring (NILM) aims to predict the status or consumption of domestic appliances in a household only by knowing the aggregated power load. NILM can be formulated as regression problem or most often as a classification problem. Most datasets gathered by smart meters allow to define naturally a regression problem, but the corresponding classification problem is a derived one, since it requires a conversion from the power signal to the status of each device by a thresholding method. We treat three different thresholding methods to perform this task, discussing their differences on various devices from the UK-DALE dataset. We analyze the performance of deep learning state-of-the-art architectures on both the regression and classification problems, introducing criteria to select the most convenient thresholding method.
Assessing the effect of advertising expenditures upon sales: a Bayesian structural time series model
Apr 23, 2018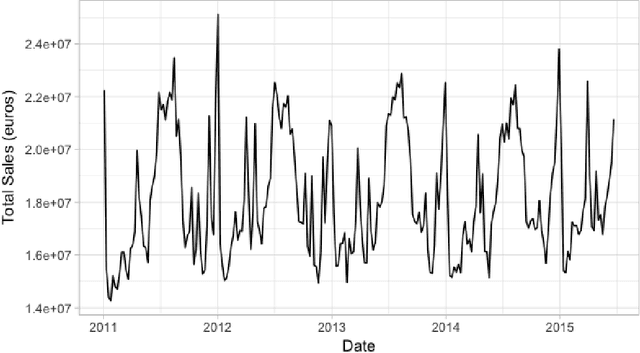
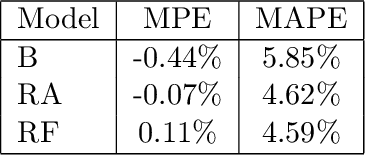
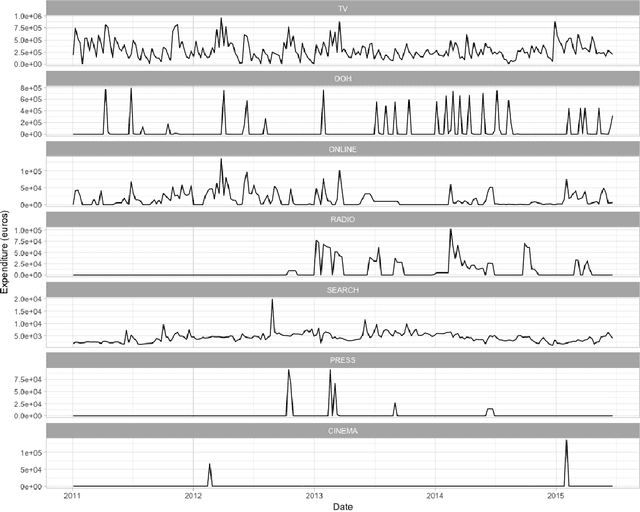

Abstract:We propose a robust implementation of the Nerlove--Arrow model using a Bayesian structural time series model to explain the relationship between advertising expenditures of a country-wide fast-food franchise network with its weekly sales. Thanks to the flexibility and modularity of the model, it is well suited to generalization to other markets or situations. Its Bayesian nature facilitates incorporating \emph{a priori} information (the manager's views), which can be updated with relevant data. This aspect of the model will be used to present a strategy of budget scheduling across time and channels.
 Add to Chrome
 Add to Firefox
 Add to Edge