Daniel Wiegreffe
MDsrv -- visual sharing and analysis of molecular dynamics simulations
Mar 25, 2022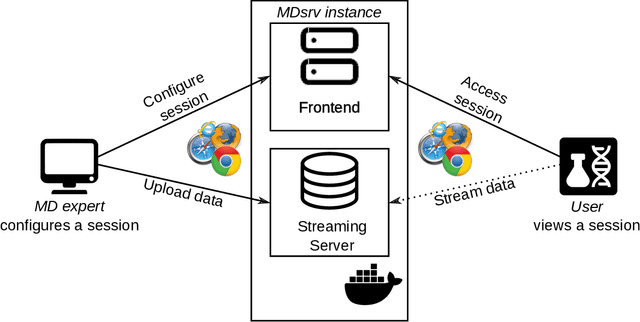
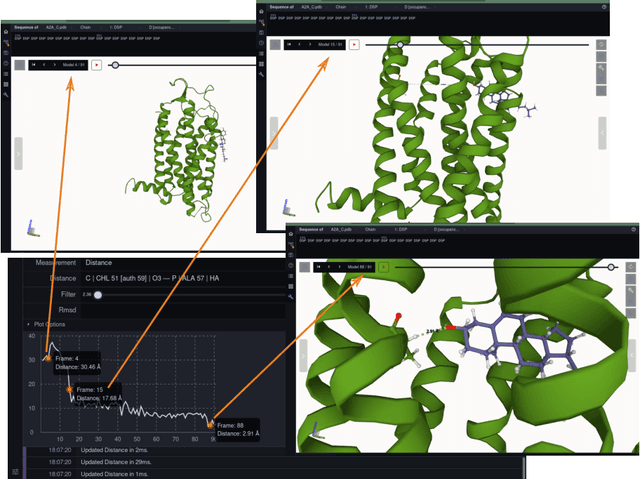
Abstract:Molecular dynamics simulation is a proven technique for computing and visualizing the time-resolved motion of macromolecules at atomic resolution. The MDsrv is a tool that streams MD trajectories and displays them interactively in web browsers without requiring advanced skills, facilitating interactive exploration and collaborative visual analysis. We have now enhanced the MDsrv to further simplify the upload and sharing of MD trajectories and improve their online viewing and analysis. With the new instance, the MDsrv simplifies the creation of sessions, which allows the exchange of MD trajectories with preset representations and perspectives. An important innovation is that the MDsrv can now access and visualize trajectories from remote datasets, which greatly expands its applicability and use, as the data no longer needs to be accessible on a local server. In addition, initial analyses such as sequence or structure alignments, distance measurements, or RMSD calculations have been implemented, which optionally support visual analysis. Finally, the MDsrv now offers a faster and more efficient visualization of even large trajectories.
Mining Legacy Issues in Open Pit Mining Sites: Innovation & Support of Renaturalization and Land Utilization
May 13, 2021
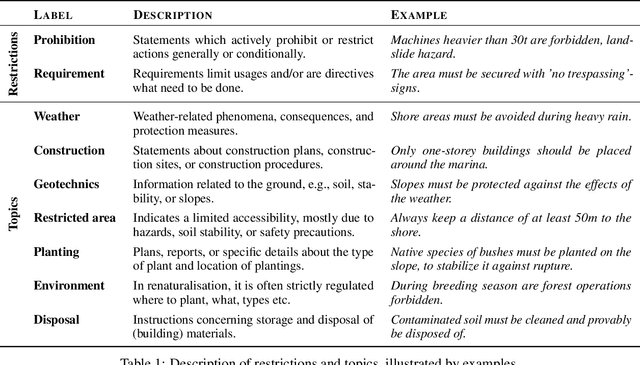
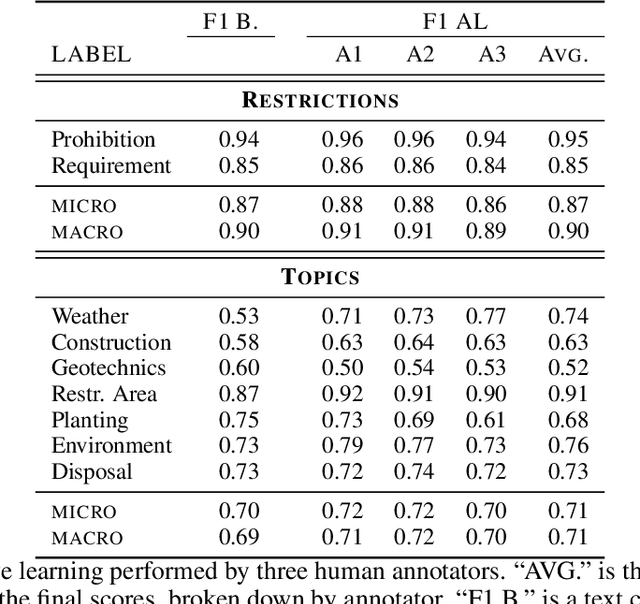
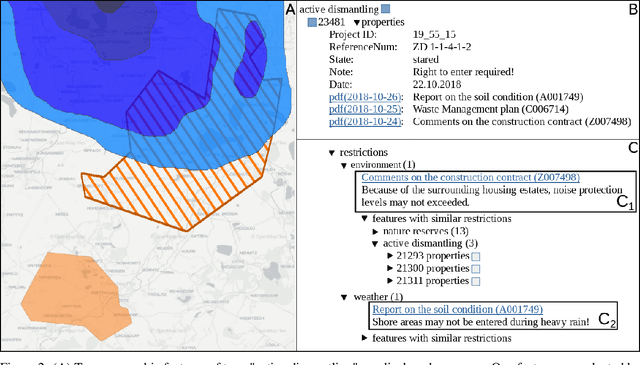
Abstract:Open pit mines left many regions worldwide inhospitable or uninhabitable. To put these regions back into use, entire stretches of land must be renaturalized. For the sustainable subsequent use or transfer to a new primary use, many contaminated sites and soil information have to be permanently managed. In most cases, this information is available in the form of expert reports in unstructured data collections or file folders, which in the best case are digitized. Due to size and complexity of the data, it is difficult for a single person to have an overview of this data in order to be able to make reliable statements. This is one of the most important obstacles to the rapid transfer of these areas to after-use. An information-based approach to this issue supports fulfilling several Sustainable Development Goals regarding environment issues, health and climate action. We use a stack of Optical Character Recognition, Text Classification, Active Learning and Geographic Information System Visualization to effectively mine and visualize this information. Subsequently, we link the extracted information to geographic coordinates and visualize them using a Geographic Information System. Active Learning plays a vital role because our dataset provides no training data. In total, we process nine categories and actively learn their representation in our dataset. We evaluate the OCR, Active Learning and Text Classification separately to report the performance of the system. Active Learning and text classification results are twofold: Whereas our categories about restrictions work sufficient ($>$.85 F1), the seven topic-oriented categories were complicated for human coders and hence the results achieved mediocre evaluation scores ($<$.70 F1).
 Add to Chrome
 Add to Firefox
 Add to Edge