Caroline Jay
Comparing how Large Language Models perform against keyword-based searches for social science research data discovery
Jan 27, 2026Abstract:This paper evaluates the performance of a large language model (LLM) based semantic search tool relative to a traditional keyword-based search for data discovery. Using real-world search behaviour, we compare outputs from a bespoke semantic search system applied to UKRI data services with the Consumer Data Research Centre (CDRC) keyword search. Analysis is based on 131 of the most frequently used search terms extracted from CDRC search logs between December 2023 and October 2024. We assess differences in the volume, overlap, ranking, and relevance of returned datasets using descriptive statistics, qualitative inspection, and quantitative similarity measures, including exact dataset overlap, Jaccard similarity, and cosine similarity derived from BERT embeddings. Results show that the semantic search consistently returns a larger number of results than the keyword search and performs particularly well for place based, misspelled, obscure, or complex queries. While the semantic search does not capture all keyword based results, the datasets returned are overwhelmingly semantically similar, with high cosine similarity scores despite lower exact overlap. Rankings of the most relevant results differ substantially between tools, reflecting contrasting prioritisation strategies. Case studies demonstrate that the LLM based tool is robust to spelling errors, interprets geographic and contextual relevance effectively, and supports natural-language queries that keyword search fails to resolve. Overall, the findings suggest that LLM driven semantic search offers a substantial improvement for data discovery, complementing rather than fully replacing traditional keyword-based approaches.
From keywords to semantics: Perceptions of large language models in data discovery
Oct 01, 2025Abstract:Current approaches to data discovery match keywords between metadata and queries. This matching requires researchers to know the exact wording that other researchers previously used, creating a challenging process that could lead to missing relevant data. Large Language Models (LLMs) could enhance data discovery by removing this requirement and allowing researchers to ask questions with natural language. However, we do not currently know if researchers would accept LLMs for data discovery. Using a human-centered artificial intelligence (HCAI) focus, we ran focus groups (N = 27) to understand researchers' perspectives towards LLMs for data discovery. Our conceptual model shows that the potential benefits are not enough for researchers to use LLMs instead of current technology. Barriers prevent researchers from fully accepting LLMs, but features around transparency could overcome them. Using our model will allow developers to incorporate features that result in an increased acceptance of LLMs for data discovery.
Contrasting Attitudes Towards Current and Future AI Applications for Computerised Interpretation of ECG: A Clinical Stakeholder Interview Study
Oct 22, 2024

Abstract:Objectives: To investigate clinicians' attitudes towards current automated interpretation of ECG and novel AI technologies and their perception of computer-assisted interpretation. Materials and Methods: We conducted a series of interviews with clinicians in the UK. Our study: (i) explores the potential for AI, specifically future 'human-like' computing approaches, to facilitate ECG interpretation and support clinical decision making, and (ii) elicits their opinions about the importance of explainability and trustworthiness of AI algorithms. Results: We performed inductive thematic analysis on interview transcriptions from 23 clinicians and identified the following themes: (i) a lack of trust in current systems, (ii) positive attitudes towards future AI applications and requirements for these, (iii) the relationship between the accuracy and explainability of algorithms, and (iv) opinions on education, possible deskilling, and the impact of AI on clinical competencies. Discussion: Clinicians do not trust current computerised methods, but welcome future 'AI' technologies. Where clinicians trust future AI interpretation to be accurate, they are less concerned that it is explainable. They also preferred ECG interpretation that demonstrated the results of the algorithm visually. Whilst clinicians do not fear job losses, they are concerned about deskilling and the need to educate the workforce to use AI responsibly. Conclusion: Clinicians are positive about the future application of AI in clinical decision-making. Accuracy is a key factor of uptake and visualisations are preferred over current computerised methods. This is viewed as a potential means of training and upskilling, in contrast to the deskilling that automation might be perceived to bring.
Using Interaction Data to Predict Engagement with Interactive Media
Aug 04, 2021
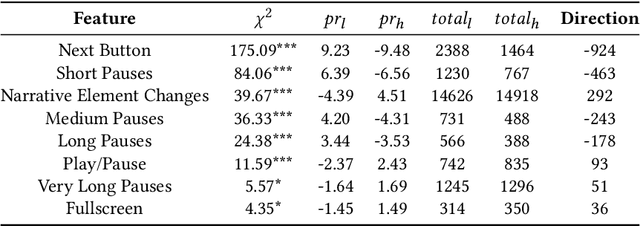
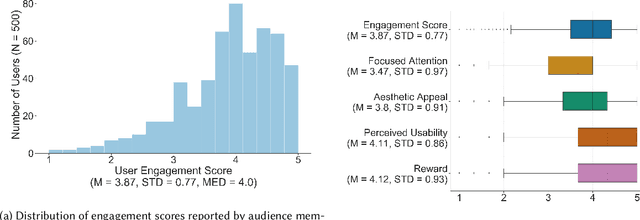
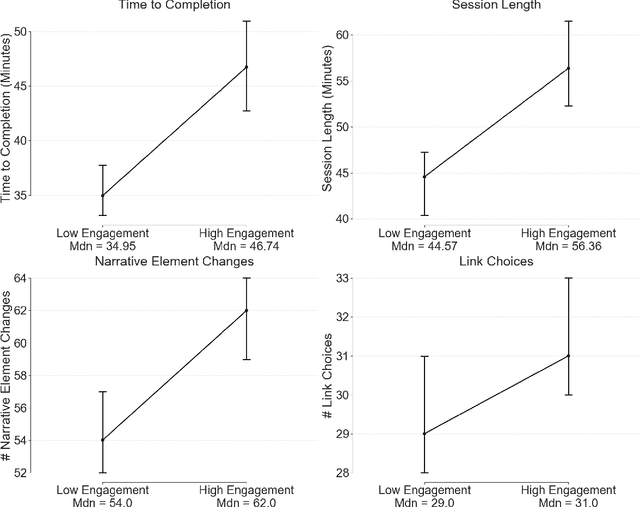
Abstract:Media is evolving from traditional linear narratives to personalised experiences, where control over information (or how it is presented) is given to individual audience members. Measuring and understanding audience engagement with this media is important in at least two ways: (1) a post-hoc understanding of how engaged audiences are with the content will help production teams learn from experience and improve future productions; (2), this type of media has potential for real-time measures of engagement to be used to enhance the user experience by adapting content on-the-fly. Engagement is typically measured by asking samples of users to self-report, which is time consuming and expensive. In some domains, however, interaction data have been used to infer engagement. Fortuitously, the nature of interactive media facilitates a much richer set of interaction data than traditional media; our research aims to understand if these data can be used to infer audience engagement. In this paper, we report a study using data captured from audience interactions with an interactive TV show to model and predict engagement. We find that temporal metrics, including overall time spent on the experience and the interval between events, are predictive of engagement. The results demonstrate that interaction data can be used to infer users' engagement during and after an experience, and the proposed techniques are relevant to better understand audience preference and responses.
Number and quality of diagrams in scholarly publications is associated with number of citations
Apr 30, 2021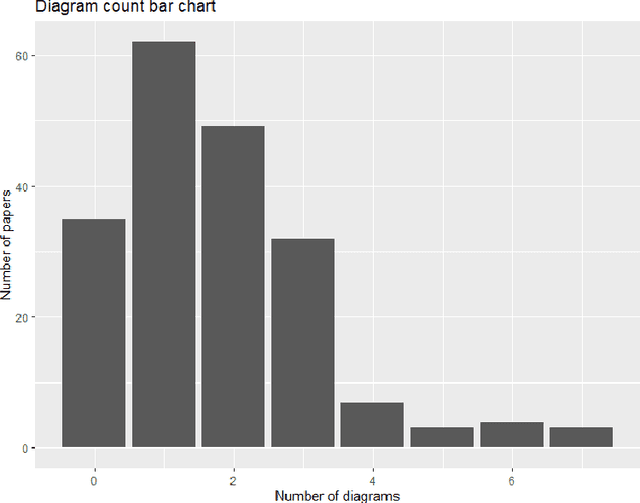
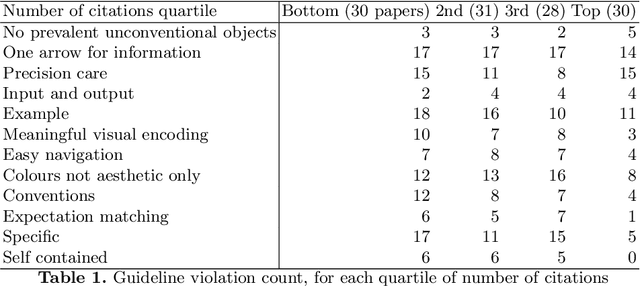
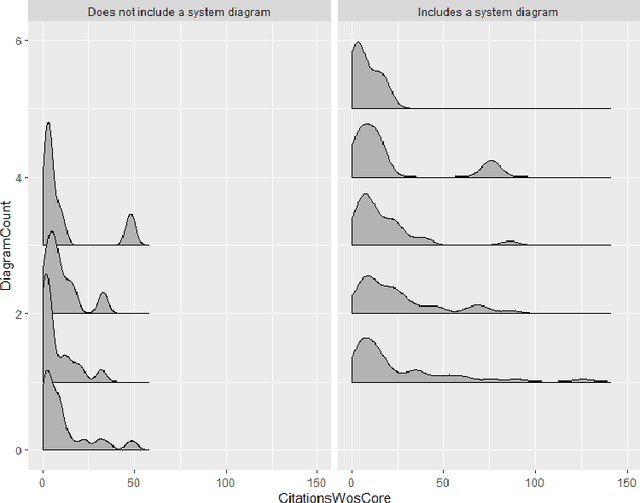

Abstract:Diagrams are often used in scholarly communication. We analyse a corpus of diagrams found in scholarly computational linguistics conference proceedings (ACL 2017), and find inclusion of a system diagram to be correlated with higher numbers of citations after 3 years. Inclusion of over three diagrams in this 8-page limit conference was found to correlate with a lower citation count. Focusing on neural network system diagrams, we find a correlation between highly cited papers and "good diagramming practice" quantified by level of compliance with a set of diagramming guidelines. Two diagram classification types (one visually based, one mental model based) were not found to correlate with number of citations, but enabled quantification of heterogeneity in those dimensions. Exploring scholarly paper-writing guides, we find diagrams to be a neglected media. This study suggests that diagrams may be a useful source of quality data for predicting citations, and that "graphicacy" is a key skill for scholars with insufficient support at present.
Scholarly AI system diagrams as an access point to mental models
Apr 30, 2021


Abstract:Complex systems, such as Artificial Intelligence (AI) systems, are comprised of many interrelated components. In order to represent these systems, demonstrating the relations between components is essential. Perhaps because of this, diagrams, as "icons of relation", are a prevalent medium for signifying complex systems. Diagrams used to communicate AI system architectures are currently extremely varied. The diversity in diagrammatic conceptual modelling choices provides an opportunity to gain insight into the aspects which are being prioritised for communication. In this philosophical exploration of AI systems diagrams, we integrate theories of conceptual models, communication theory, and semiotics. We discuss consequences of standardised diagrammatic languages for AI systems, concluding that while we expect engineers implementing systems to benefit from standards, researchers would have a larger benefit from guidelines.
Structuralist analysis for neural network system diagrams
Apr 30, 2021


Abstract:This short paper examines diagrams describing neural network systems in academic conference proceedings. Many aspects of scholarly communication are controlled, particularly with relation to text and formatting, but often diagrams are not centrally curated beyond a peer review. Using a corpus-based approach, we argue that the heterogeneous diagrammatic notations used for neural network systems has implications for signification in this domain. We divide this into (i) what content is being represented and (ii) how relations are encoded. Using a novel structuralist framework, we use a corpus analysis to quantitatively cluster diagrams according to the author's representational choices. This quantitative diagram classification in a heterogeneous domain may provide a foundation for further analysis.
How Researchers Use Diagrams in Communicating Neural Network Systems
Aug 31, 2020


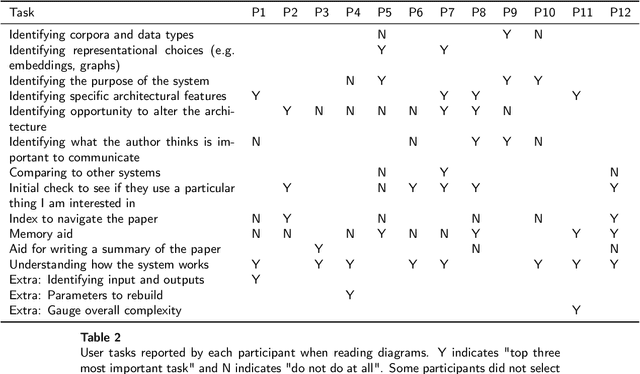
Abstract:Neural networks are a prevalent and effective machine learning component, and their application is leading to significant scientific progress in many domains. As the field of neural network systems is fast growing, it is important to understand how advances are communicated. Diagrams are key to this, appearing in almost all papers describing novel systems. This paper reports on a study into the use of neural network system diagrams, through interviews, card sorting, and qualitative feedback structured around ecologically-derived examples. We find high diversity of usage, perception and preference in both creation and interpretation of diagrams, examining this in the context of existing design, information visualisation, and user experience guidelines. Considering the interview data alongside existing guidance, we propose guidelines aiming to improve the way in which neural network system diagrams are constructed.
Understanding scholarly Natural Language Processing system diagrams through application of the Richards-Engelhardt framework
Aug 26, 2020
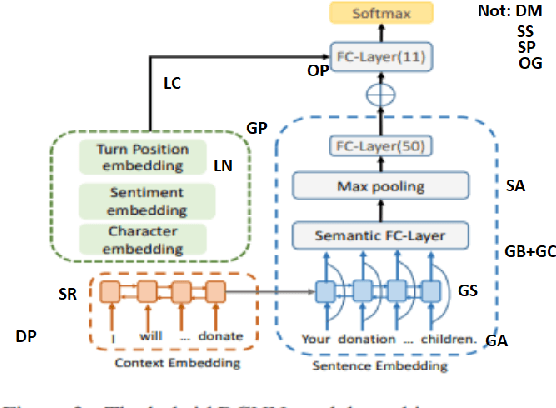
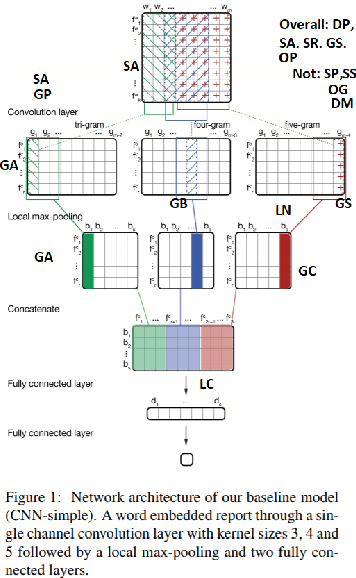

Abstract:We utilise Richards-Engelhardt framework as a tool for understanding Natural Language Processing systems diagrams. Through four examples from scholarly proceedings, we find that the application of the framework to this ecological and complex domain is effective for reflecting on these diagrams. We argue for vocabulary to describe multiple-codings, semiotic variability, and inconsistency or misuse of visual encoding principles in diagrams. Further, for application to scholarly Natural Language Processing systems, and perhaps systems diagrams more broadly, we propose the addition of "Grouping by Object" as a new visual encoding principle, and "Emphasising" as a new visual encoding type.
 Add to Chrome
 Add to Firefox
 Add to Edge