Ashlynn R. Daughton
A-1 Information Systems and Modeling, Los Alamos National Lab, Los Alamos, NM, USA
Impact of COVID-19 Policies and Misinformation on Social Unrest
Oct 07, 2021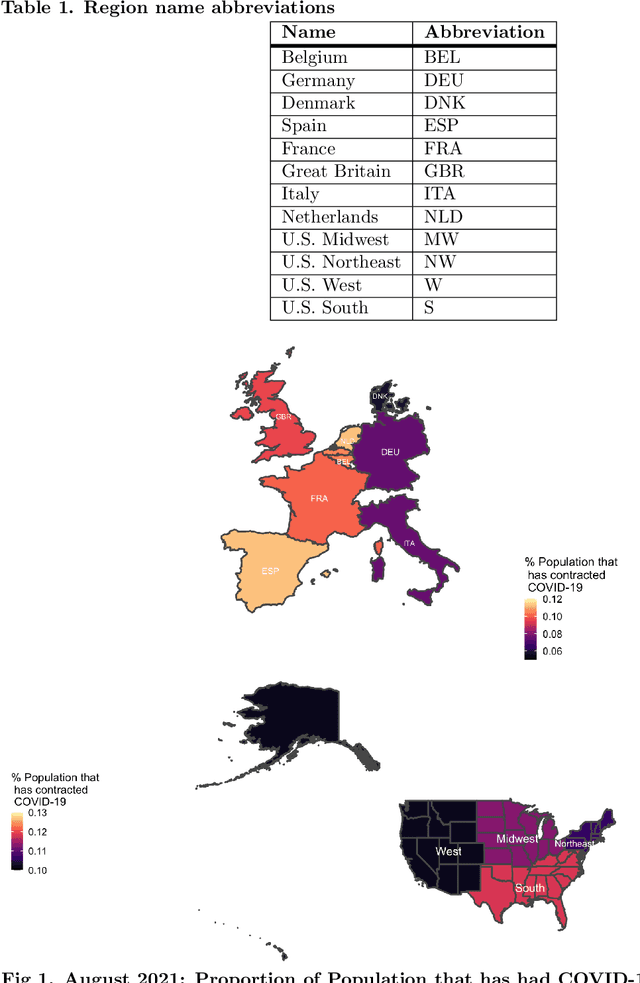

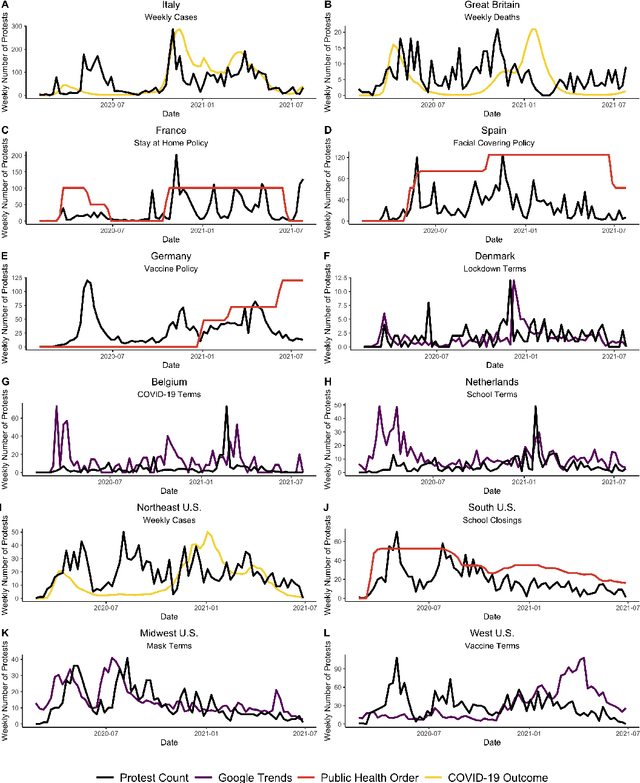
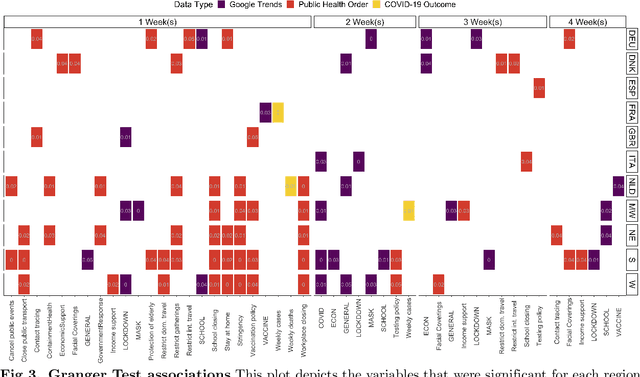
Abstract:The novel coronavirus disease (COVID-19) pandemic has impacted every corner of earth, disrupting governments and leading to socioeconomic instability. This crisis has prompted questions surrounding how different sectors of society interact and influence each other during times of change and stress. Given the unprecedented economic and societal impacts of this pandemic, many new data sources have become available, allowing us to quantitatively explore these associations. Understanding these relationships can help us better prepare for future disasters and mitigate the impacts. Here, we focus on the interplay between social unrest (protests), health outcomes, public health orders, and misinformation in eight countries of Western Europe and four regions of the United States. We created 1-3 week forecasts of both a binary protest metric for identifying times of high protest activity and the overall protest counts over time. We found that for all regions, except Belgium, at least one feature from our various data streams was predictive of protests. However, the accuracy of the protest forecasts varied by country, that is, for roughly half of the countries analyzed, our forecasts outperform a na\"ive model. These mixed results demonstrate the potential of diverse data streams to predict a topic as volatile as protests as well as the difficulties of predicting a situation that is as rapidly evolving as a pandemic.
"Thought I'd Share First": An Analysis of COVID-19 Conspiracy Theories and Misinformation Spread on Twitter
Dec 14, 2020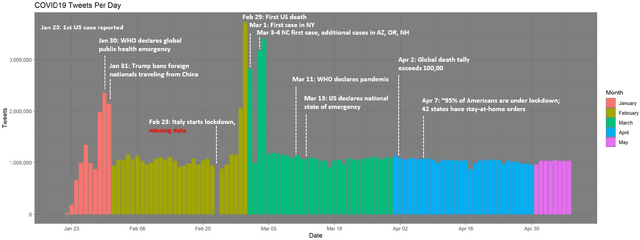
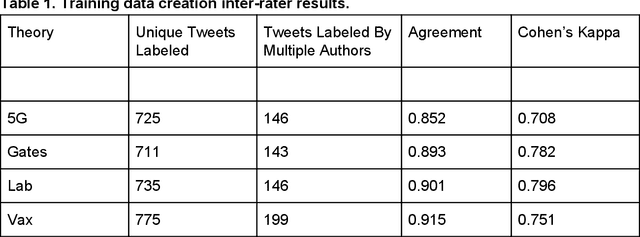


Abstract:Background: Misinformation spread through social media is a growing problem, and the emergence of COVID-19 has caused an explosion in new activity and renewed focus on the resulting threat to public health. Given this increased visibility, in-depth analysis of COVID-19 misinformation spread is critical to understanding the evolution of ideas with potential negative public health impact. Methods: Using a curated data set of COVID-19 tweets (N ~120 million tweets) spanning late January to early May 2020, we applied methods including regular expression filtering, supervised machine learning, sentiment analysis, geospatial analysis, and dynamic topic modeling to trace the spread of misinformation and to characterize novel features of COVID-19 conspiracy theories. Results: Random forest models for four major misinformation topics provided mixed results, with narrowly-defined conspiracy theories achieving F1 scores of 0.804 and 0.857, while more broad theories performed measurably worse, with scores of 0.654 and 0.347. Despite this, analysis using model-labeled data was beneficial for increasing the proportion of data matching misinformation indicators. We were able to identify distinct increases in negative sentiment, theory-specific trends in geospatial spread, and the evolution of conspiracy theory topics and subtopics over time. Conclusions: COVID-19 related conspiracy theories show that history frequently repeats itself, with the same conspiracy theories being recycled for new situations. We use a combination of supervised learning, unsupervised learning, and natural language processing techniques to look at the evolution of theories over the first four months of the COVID-19 outbreak, how these theories intertwine, and to hypothesize on more effective public health messaging to combat misinformation in online spaces.
 Add to Chrome
 Add to Firefox
 Add to Edge