Antti Vehkaoja
Classification of Volatile Organic Compounds by Differential Mobility Spectrometry Based on Continuity of Alpha Curves
Jan 13, 2024Abstract:Background: Classification of volatile organic compounds (VOCs) is of interest in many fields. Examples include but are not limited to medicine, detection of explosives, and food quality control. Measurements collected with electronic noses can be used for classification and analysis of VOCs. One type of electronic noses that has seen considerable development in recent years is Differential Mobility Spectrometry (DMS). DMS yields measurements that are visualized as dispersion plots that contain traces, also known as alpha curves. Current methods used for analyzing DMS dispersion plots do not usually utilize the information stored in the continuity of these traces, which suggests that alternative approaches should be investigated. Results: In this work, for the first time, dispersion plots were interpreted as a series of measurements evolving sequentially. Thus, it was hypothesized that time-series classification algorithms can be effective for classification and analysis of dispersion plots. An extensive dataset of 900 dispersion plots for five chemicals measured at five flow rates and two concentrations was collected. The data was used to analyze the classification performance of six algorithms. According to our hypothesis, the highest classification accuracy of 88\% was achieved by a Long-Short Term Memory neural network, which supports our hypothesis. Significance: A new concept for approaching classification tasks of dispersion plots is presented and compared with other well-known classification algorithms. This creates a new angle of view for analysis and classification of the dispersion plots. In addition, a new dataset of dispersion plots is openly shared to public.
A benchmark for computational analysis of animal behavior, using animal-borne tags
May 18, 2023Abstract:Animal-borne sensors ('bio-loggers') can record a suite of kinematic and environmental data, which can elucidate animal ecophysiology and improve conservation efforts. Machine learning techniques are useful for interpreting the large amounts of data recorded by bio-loggers, but there exists no standard for comparing the different machine learning techniques in this domain. To address this, we present the Bio-logger Ethogram Benchmark (BEBE), a collection of datasets with behavioral annotations, standardized modeling tasks, and evaluation metrics. BEBE is to date the largest, most taxonomically diverse, publicly available benchmark of this type, and includes 1654 hours of data collected from 149 individuals across nine taxa. We evaluate the performance of ten different machine learning methods on BEBE, and identify key challenges to be addressed in future work. Datasets, models, and evaluation code are made publicly available at https://github.com/earthspecies/BEBE, to enable community use of BEBE as a point of comparison in methods development.
Signal-to-noise ratio is more important than sampling rate in beat-to-beat interval estimation from optical sensors
Feb 28, 2022


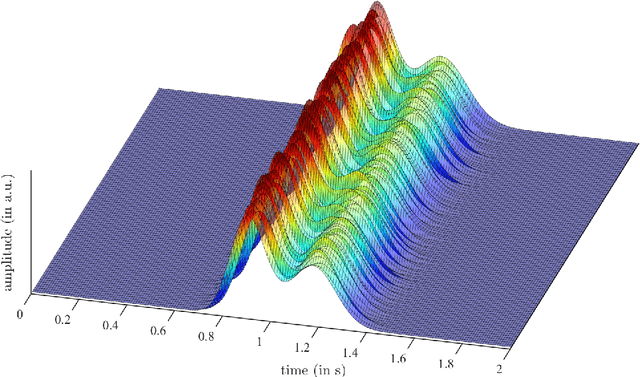
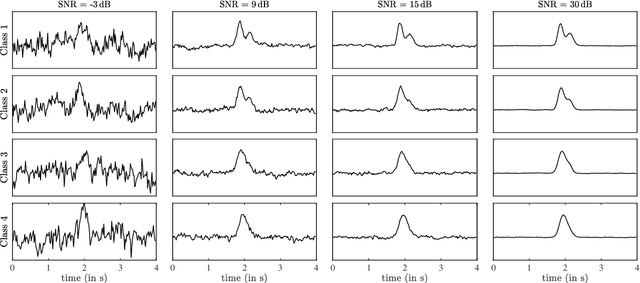
Abstract:Photoplethysmographic Imaging (PPGI) allows the determination of pulse rate variability from sequential beat-to-beat intervals (BBI) and pulse wave velocity from spatially resolved recorded pulse waves. In either case, sufficient temporal accuracy is essential. The presented work investigates the temporal accuracy of BBI estimation from photoplethysmographic signals. Within comprehensive numerical simulation, we systematically assess the impact of sampling rate, signal-to-noise ratio (SNR), and beat-to-beat shape variations on the root mean square error (RMSE) between real and estimated BBI. Our results show that at sampling rates beyond 14 Hz only small errors exist when interpolation is used. For example, the average RMSE is 3 ms for a sampling rate of 14 Hz and an SNR of 18 dB. Further increasing the sampling rate only results in marginal improvements, e.g. more than tripling the sampling rate to 50 Hz reduces the error by approx. 14%. The most important finding relates to the SNR, which is shown to have a much stronger influence on the error than the sampling rate. For example, increasing the SNR from 18 dB to 24 dB at 14 Hz sampling rate reduced the error by almost 50% to 1.5 ms. Subtle beat-to-beat shape variations, moreover, increase the error decisively by up to 800%. Our results are highly relevant in three regards: first, they partially explain different results in the literature on minimum sampling rates. Second, they emphasize the importance to consider SNR and possibly shape variation in investigations on the minimal sampling rate. Third, they underline the importance of appropriate processing techniques to increase SNR. Importantly, though our motivation is PPGI, the presented work immediately applies to contact PPG and PPG in other settings such as wearables. To enable further investigations, we make the scripts used in modelling and simulation freely available.
* 18 pages, 11 figures
 Add to Chrome
 Add to Firefox
 Add to Edge