Annabelle Redelmeier
shapr: Explaining Machine Learning Models with Conditional Shapley Values in R and Python
Apr 02, 2025Abstract:This paper introduces the shapr package, a versatile tool for generating Shapley value explanations for machine learning and statistical regression models in both R and Python. The package emphasizes conditional Shapley value estimates, providing a comprehensive range of approaches for accurately capturing feature dependencies, which is crucial for correct model interpretation and lacking in similar software. In addition to regular tabular data, the shapr R-package includes specialized functionality for explaining time series forecasts. The package offers a minimal set of user functions with sensible defaults for most use cases while providing extensive flexibility for advanced users to fine-tune computations. Additional features include parallelized computations, iterative estimation with convergence detection, and rich visualization tools. shapr also extends its functionality to compute causal and asymmetric Shapley values when causal information is available. In addition, we introduce the shaprpy Python library, which brings core capabilities of shapr to the Python ecosystem. Overall, the package aims to enhance the interpretability of predictive models within a powerful and user-friendly framework.
MCCE: Monte Carlo sampling of realistic counterfactual explanations
Nov 18, 2021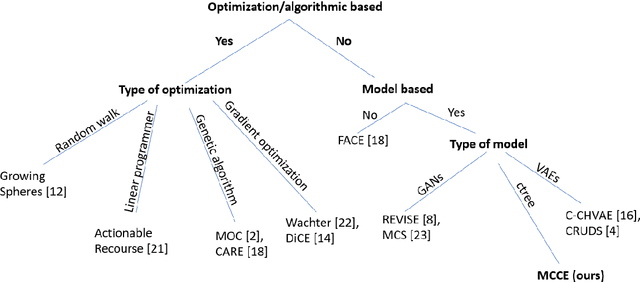
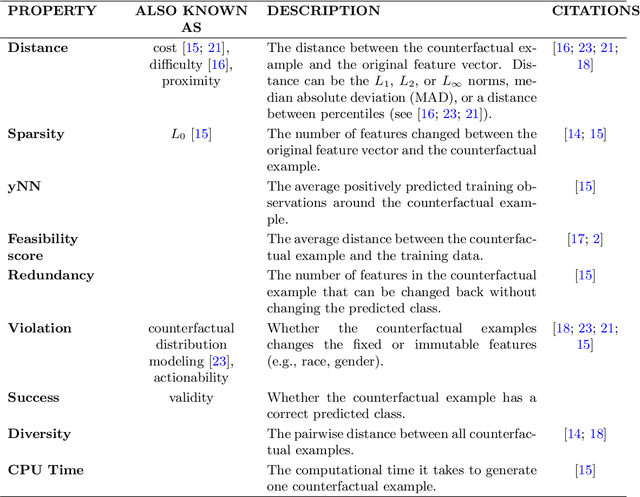


Abstract:In this paper we introduce MCCE: Monte Carlo sampling of realistic Counterfactual Explanations, a model-based method that generates counterfactual explanations by producing a set of feasible examples using conditional inference trees. Unlike algorithmic-based counterfactual methods that have to solve complex optimization problems or other model based methods that model the data distribution using heavy machine learning models, MCCE is made up of only two light-weight steps (generation and post-processing). MCCE is also straightforward for the end user to understand and implement, handles any type of predictive model and type of feature, takes into account actionability constraints when generating the counterfactual explanations, and generates as many counterfactual explanations as needed. In this paper we introduce MCCE and give a comprehensive list of performance metrics that can be used to compare counterfactual explanations. We also compare MCCE with a range of state-of-the-art methods and a new baseline method on benchmark data sets. MCCE outperforms all model-based methods and most algorithmic-based methods when also taking into account validity (i.e., a correctly changed prediction) and actionability constraints. Finally, we show that MCCE has the strength of performing almost as well when given just a small subset of the training data.
groupShapley: Efficient prediction explanation with Shapley values for feature groups
Jun 23, 2021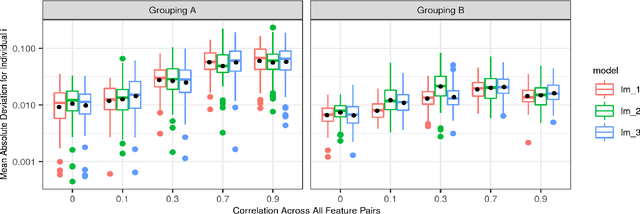


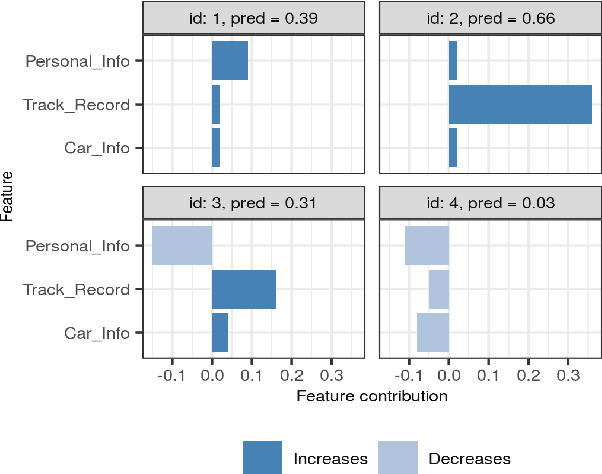
Abstract:Shapley values has established itself as one of the most appropriate and theoretically sound frameworks for explaining predictions from complex machine learning models. The popularity of Shapley values in the explanation setting is probably due to its unique theoretical properties. The main drawback with Shapley values, however, is that its computational complexity grows exponentially in the number of input features, making it unfeasible in many real world situations where there could be hundreds or thousands of features. Furthermore, with many (dependent) features, presenting/visualizing and interpreting the computed Shapley values also becomes challenging. The present paper introduces groupShapley: a conceptually simple approach for dealing with the aforementioned bottlenecks. The idea is to group the features, for example by type or dependence, and then compute and present Shapley values for these groups instead of for all individual features. Reducing hundreds or thousands of features to half a dozen or so, makes precise computations practically feasible and the presentation and knowledge extraction greatly simplified. We prove that under certain conditions, groupShapley is equivalent to summing the feature-wise Shapley values within each feature group. Moreover, we provide a simulation study exemplifying the differences when these conditions are not met. We illustrate the usability of the approach in a real world car insurance example, where groupShapley is used to provide simple and intuitive explanations.
Explaining predictive models with mixed features using Shapley values and conditional inference trees
Jul 02, 2020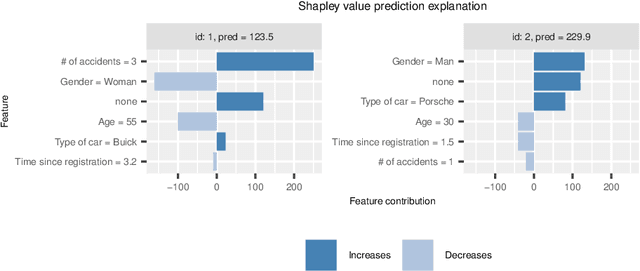
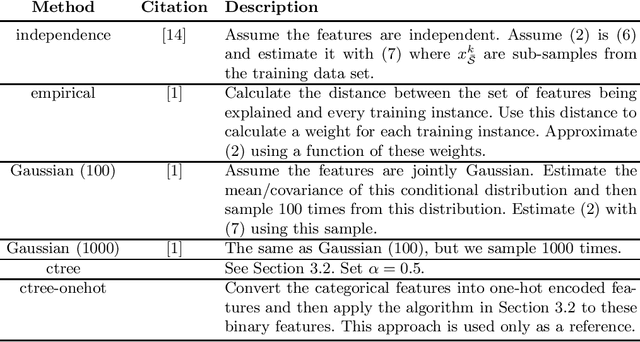

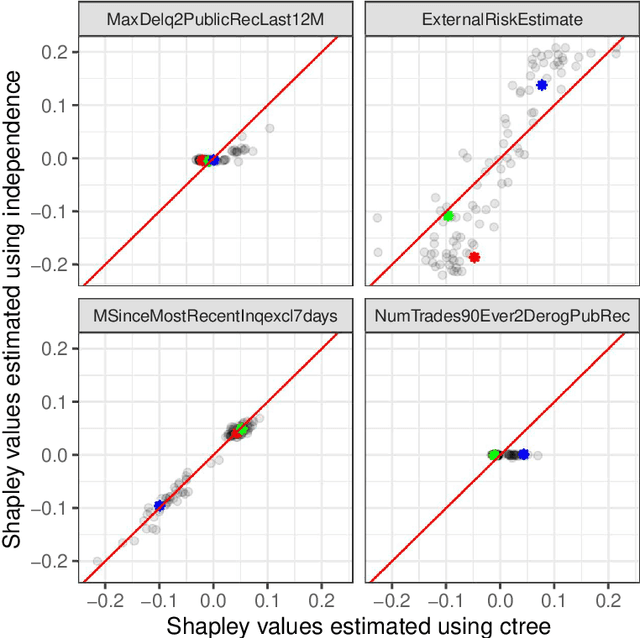
Abstract:It is becoming increasingly important to explain complex, black-box machine learning models. Although there is an expanding literature on this topic, Shapley values stand out as a sound method to explain predictions from any type of machine learning model. The original development of Shapley values for prediction explanation relied on the assumption that the features being described were independent. This methodology was then extended to explain dependent features with an underlying continuous distribution. In this paper, we propose a method to explain mixed (i.e. continuous, discrete, ordinal, and categorical) dependent features by modeling the dependence structure of the features using conditional inference trees. We demonstrate our proposed method against the current industry standards in various simulation studies and find that our method often outperforms the other approaches. Finally, we apply our method to a real financial data set used in the 2018 FICO Explainable Machine Learning Challenge and show how our explanations compare to the FICO challenge Recognition Award winning team.
 Add to Chrome
 Add to Firefox
 Add to Edge