Anders Løland
MCCE: Monte Carlo sampling of realistic counterfactual explanations
Nov 18, 2021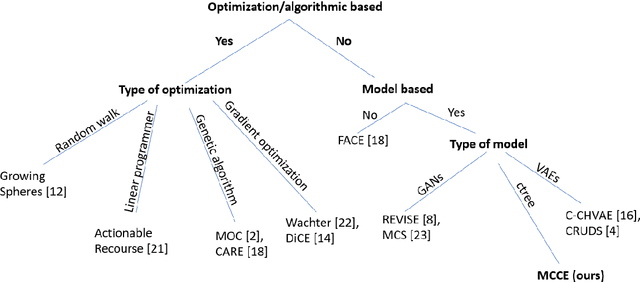
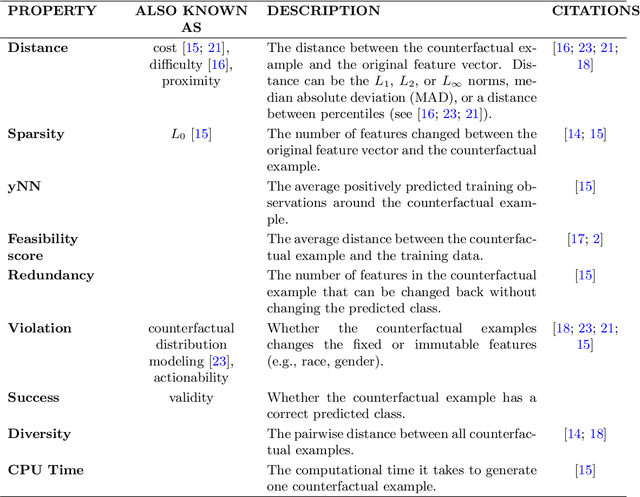


Abstract:In this paper we introduce MCCE: Monte Carlo sampling of realistic Counterfactual Explanations, a model-based method that generates counterfactual explanations by producing a set of feasible examples using conditional inference trees. Unlike algorithmic-based counterfactual methods that have to solve complex optimization problems or other model based methods that model the data distribution using heavy machine learning models, MCCE is made up of only two light-weight steps (generation and post-processing). MCCE is also straightforward for the end user to understand and implement, handles any type of predictive model and type of feature, takes into account actionability constraints when generating the counterfactual explanations, and generates as many counterfactual explanations as needed. In this paper we introduce MCCE and give a comprehensive list of performance metrics that can be used to compare counterfactual explanations. We also compare MCCE with a range of state-of-the-art methods and a new baseline method on benchmark data sets. MCCE outperforms all model-based methods and most algorithmic-based methods when also taking into account validity (i.e., a correctly changed prediction) and actionability constraints. Finally, we show that MCCE has the strength of performing almost as well when given just a small subset of the training data.
Statistical embedding: Beyond principal components
Jun 03, 2021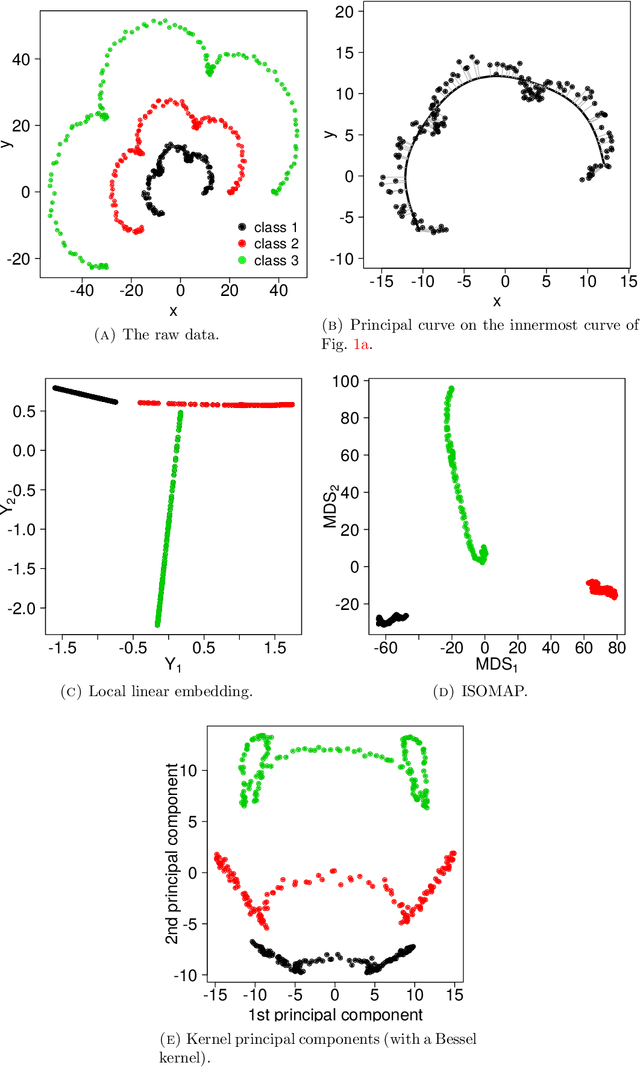
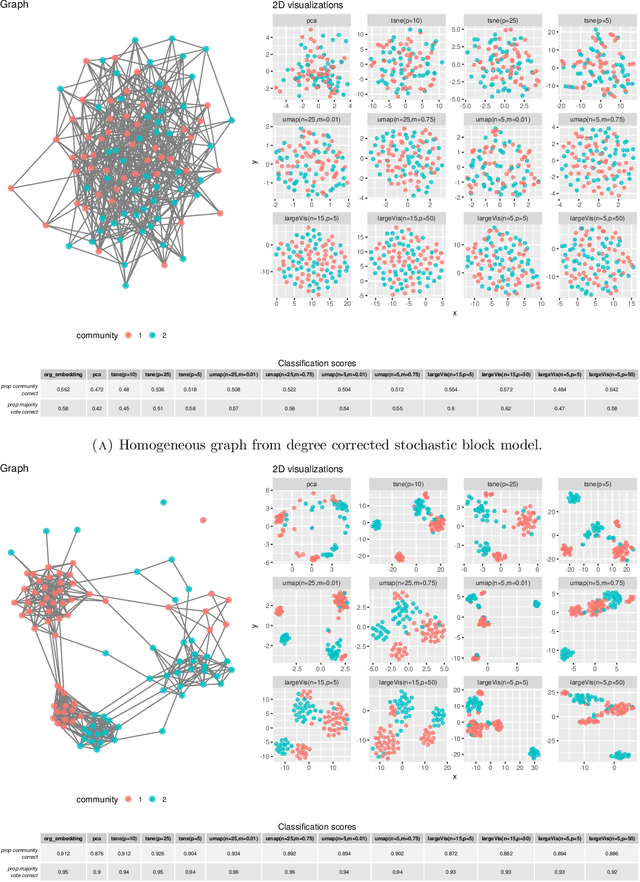


Abstract:There has been an intense recent activity in embedding of very high dimensional and nonlinear data structures, much of it in the data science and machine learning literature. We survey this activity in four parts. In the first part we cover nonlinear methods such as principal curves, multidimensional scaling, local linear methods, ISOMAP, graph based methods and kernel based methods. The second part is concerned with topological embedding methods, in particular mapping topological properties into persistence diagrams. Another type of data sets with a tremendous growth is very high-dimensional network data. The task considered in part three is how to embed such data in a vector space of moderate dimension to make the data amenable to traditional techniques such as cluster and classification techniques. The final part of the survey deals with embedding in $\mathbb{R}^2$, which is visualization. Three methods are presented: $t$-SNE, UMAP and LargeVis based on methods in parts one, two and three, respectively. The methods are illustrated and compared on two simulated data sets; one consisting of a triple of noisy Ranunculoid curves, and one consisting of networks of increasing complexity and with two types of nodes.
Explaining predictive models using Shapley values and non-parametric vine copulas
Feb 12, 2021


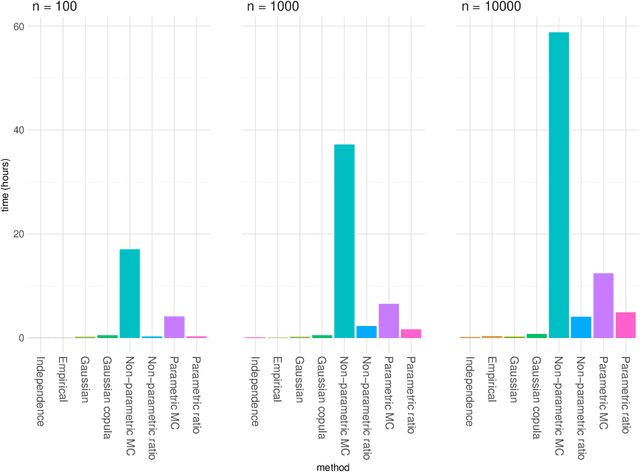
Abstract:The original development of Shapley values for prediction explanation relied on the assumption that the features being described were independent. If the features in reality are dependent this may lead to incorrect explanations. Hence, there have recently been attempts of appropriately modelling/estimating the dependence between the features. Although the proposed methods clearly outperform the traditional approach assuming independence, they have their weaknesses. In this paper we propose two new approaches for modelling the dependence between the features. Both approaches are based on vine copulas, which are flexible tools for modelling multivariate non-Gaussian distributions able to characterise a wide range of complex dependencies. The performance of the proposed methods is evaluated on simulated data sets and a real data set. The experiments demonstrate that the vine copula approaches give more accurate approximations to the true Shapley values than its competitors.
Explaining individual predictions when features are dependent: More accurate approximations to Shapley values
Mar 25, 2019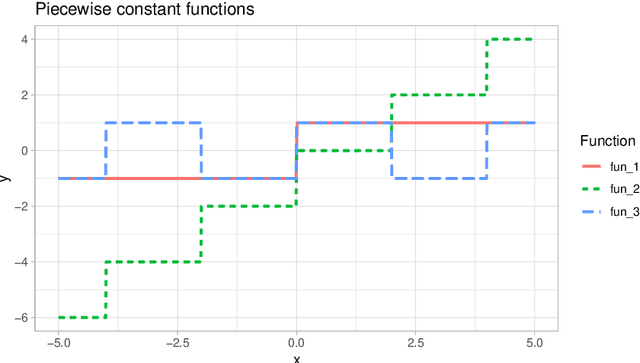
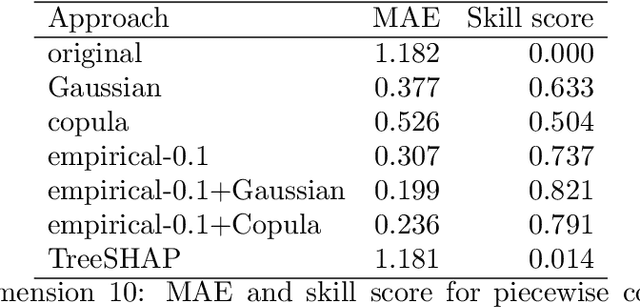


Abstract:Explaining complex or seemingly simple machine learning models is a practical and ethical question, as well as a legal issue. Can I trust the model? Is it biased? Can I explain it to others? We want to explain individual predictions from a complex machine learning model by learning simple, interpretable explanations. Of existing work on interpreting complex models, Shapley values is the only method with a solid theoretical foundation. Kernel SHAP is a computationally efficient approximation to Shapley values in higher dimensions. Like most other existing methods, this approach assumes independent features, which may give very wrong explanations. This is the case even if a simple linear model is used for predictions. We extend the Kernel SHAP method to handle dependent features. We provide several examples of linear and non-linear models with linear and non-linear feature dependence, where our method gives more accurate approximations to the true Shapley values. We also propose a method for aggregating individual Shapley values, such that the prediction can be explained by groups of dependent variables.
 Add to Chrome
 Add to Firefox
 Add to Edge