Amy Langville
Weight Set Decomposition for Weighted Rank Aggregation: An interpretable and visual decision support tool
May 31, 2022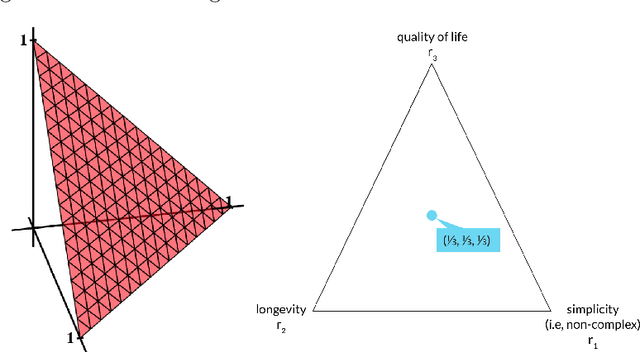
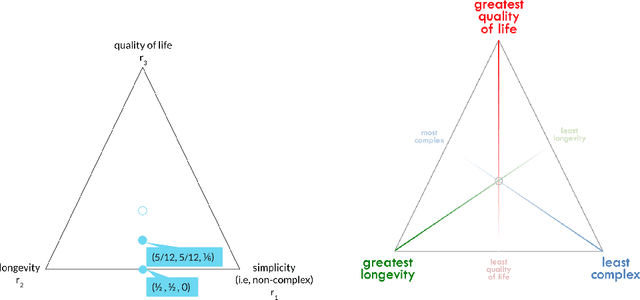
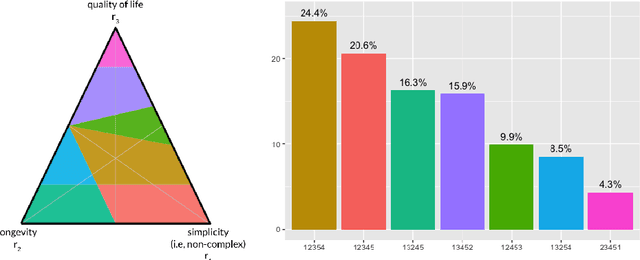
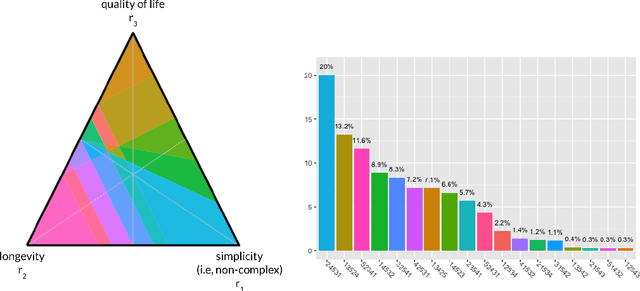
Abstract:The problem of interpreting or aggregating multiple rankings is common to many real-world applications. Perhaps the simplest and most common approach is a weighted rank aggregation, wherein a (convex) weight is applied to each input ranking and then ordered. This paper describes a new tool for visualizing and displaying ranking information for the weighted rank aggregation method. Traditionally, the aim of rank aggregation is to summarize the information from the input rankings and provide one final ranking that hopefully represents a more accurate or truthful result than any one input ranking. While such an aggregated ranking is, and clearly has been, useful to many applications, it also obscures information. In this paper, we show the wealth of information that is available for the weighted rank aggregation problem due to its structure. We apply weight set decomposition to the set of convex multipliers, study the properties useful for understanding this decomposition, and visualize the indifference regions. This methodology reveals information--that is otherwise collapsed by the aggregated ranking--into a useful, interpretable, and intuitive decision support tool. Included are multiple illustrative examples, along with heuristic and exact algorithms for computing the weight set decomposition.
Data Clustering via Principal Direction Gap Partitioning
Nov 17, 2012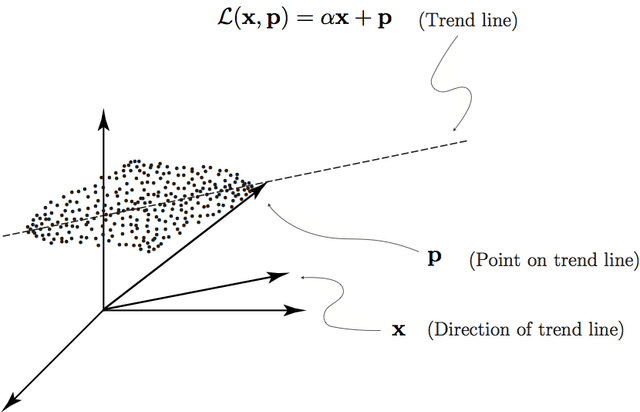
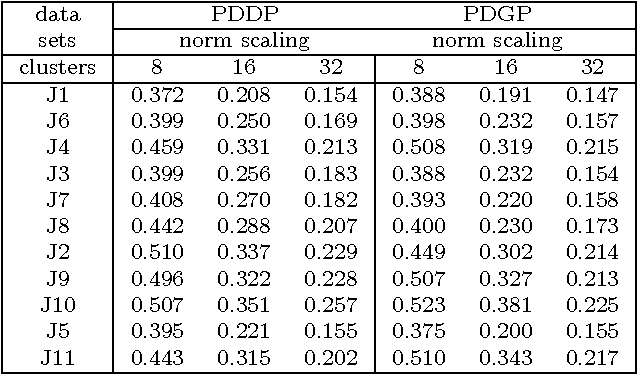
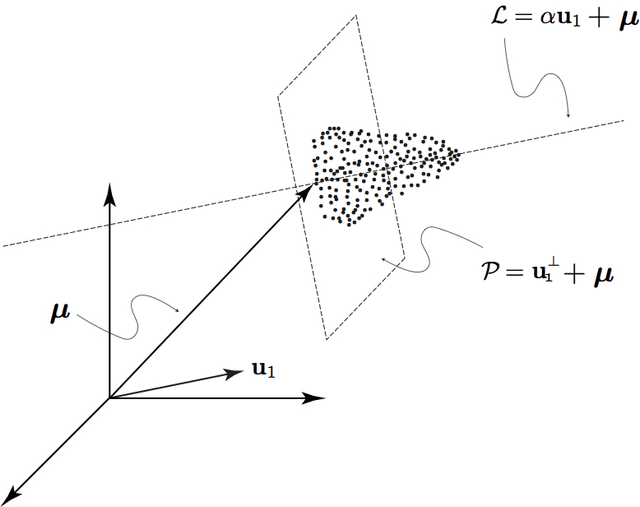
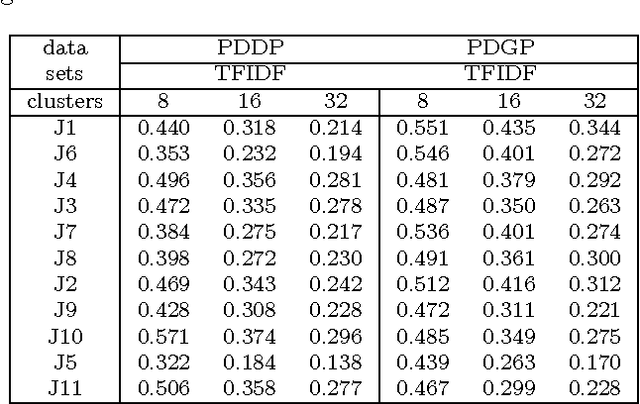
Abstract:We explore the geometrical interpretation of the PCA based clustering algorithm Principal Direction Divisive Partitioning (PDDP). We give several examples where this algorithm breaks down, and suggest a new method, gap partitioning, which takes into account natural gaps in the data between clusters. Geometric features of the PCA space are derived and illustrated and experimental results are given which show our method is comparable on the datasets used in the original paper on PDDP.
 Add to Chrome
 Add to Firefox
 Add to Edge