Visual Analytics of Movement Pattern Based on Time-Spatial Data: A Neural Net Approach
Paper and Code
Jul 09, 2017


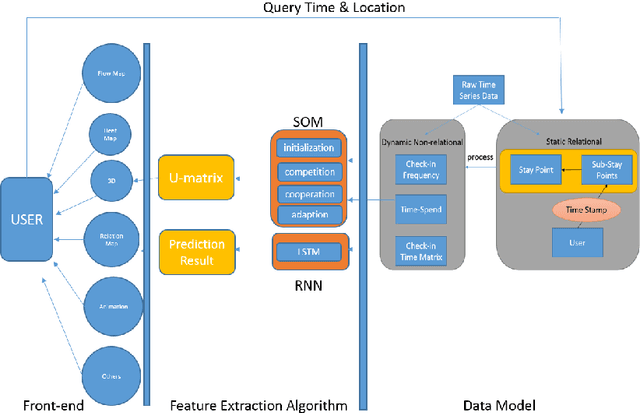
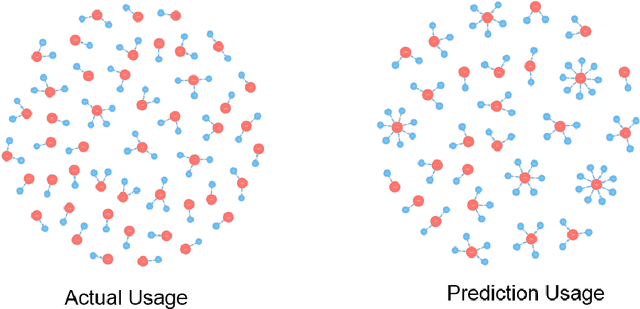
Time-Spatial data plays a crucial role for different fields such as traffic management. These data can be collected via devices such as surveillance sensors or tracking systems. However, how to efficiently an- alyze and visualize these data to capture essential embedded pattern information is becoming a big challenge today. Classic visualization ap- proaches focus on revealing 2D and 3D spatial information and modeling statistical test. Those methods would easily fail when data become mas- sive. Recent attempts concern on how to simply cluster data and perform prediction with time-oriented information. However, those approaches could still be further enhanced as they also have limitations for han- dling massive clusters and labels. In this paper, we propose a visualiza- tion methodology for mobility data using artificial neural net techniques. This method aggregates three main parts that are Back-end Data Model, Neural Net Algorithm including clustering method Self-Organizing Map (SOM) and prediction approach Recurrent Neural Net (RNN) for ex- tracting the features and lastly a solid front-end that displays the results to users with an interactive system. SOM is able to cluster the visiting patterns and detect the abnormal pattern. RNN can perform the predic- tion for time series analysis using its dynamic architecture. Furthermore, an interactive system will enable user to interpret the result with graph- ics, animation and 3D model for a close-loop feedback. This method can be particularly applied in two tasks that Commercial-based Promotion and abnormal traffic patterns detection.
 Add to Chrome
 Add to Firefox
 Add to Edge