Survey of explainable machine learning with visual and granular methods beyond quasi-explanations
Paper and Code
Sep 21, 2020


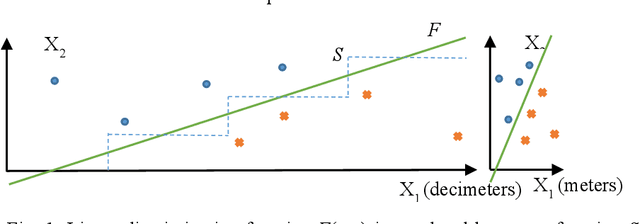
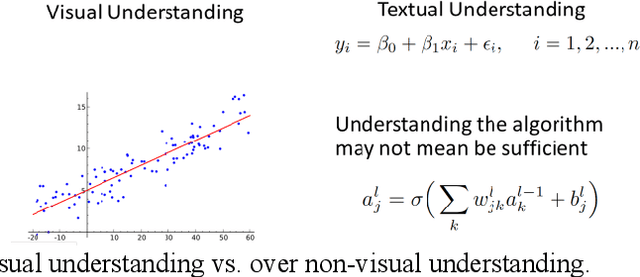
This paper surveys visual methods of explainability of Machine Learning (ML) with focus on moving from quasi-explanations that dominate in ML to domain-specific explanation supported by granular visuals. ML interpretation is fundamentally a human activity and visual methods are more readily interpretable. While efficient visual representations of high-dimensional data exist, the loss of interpretable information, occlusion, and clutter continue to be a challenge, which lead to quasi-explanations. We start with the motivation and the different definitions of explainability. The paper focuses on a clear distinction between quasi-explanations and domain specific explanations, and between explainable and an actually explained ML model that are critically important for the explainability domain. We discuss foundations of interpretability, overview visual interpretability and present several types of methods to visualize the ML models. Next, we present methods of visual discovery of ML models, with the focus on interpretable models, based on the recently introduced concept of General Line Coordinates (GLC). These methods take the critical step of creating visual explanations that are not merely quasi-explanations but are also domain specific visual explanations while these methods themselves are domain-agnostic. The paper includes results on theoretical limits to preserve n-D distances in lower dimensions, based on the Johnson-Lindenstrauss lemma, point-to-point and point-to-graph GLC approaches, and real-world case studies. The paper also covers traditional visual methods for understanding ML models, which include deep learning and time series models. We show that many of these methods are quasi-explanations and need further enhancement to become domain specific explanations. We conclude with outlining open problems and current research frontiers.
 Add to Chrome
 Add to Firefox
 Add to Edge