SmoothGrad: removing noise by adding noise
Paper and Code
Jun 12, 2017


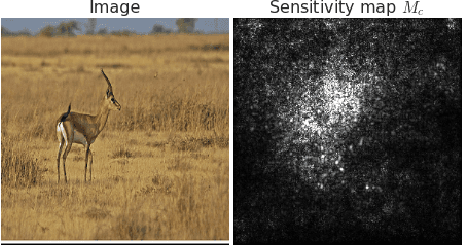
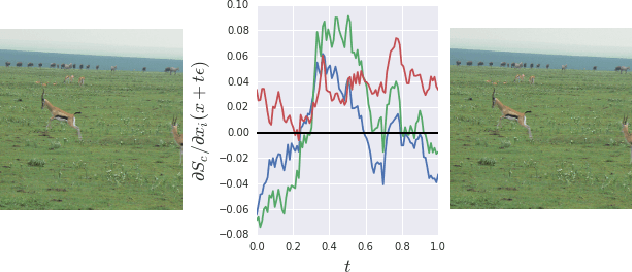
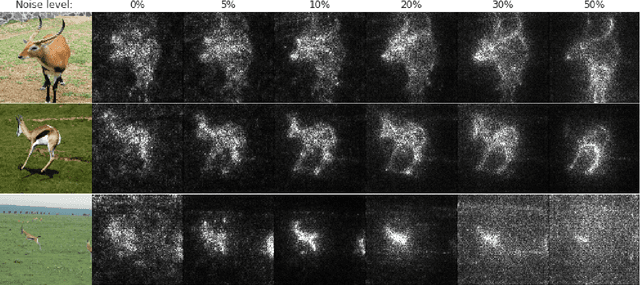
Explaining the output of a deep network remains a challenge. In the case of an image classifier, one type of explanation is to identify pixels that strongly influence the final decision. A starting point for this strategy is the gradient of the class score function with respect to the input image. This gradient can be interpreted as a sensitivity map, and there are several techniques that elaborate on this basic idea. This paper makes two contributions: it introduces SmoothGrad, a simple method that can help visually sharpen gradient-based sensitivity maps, and it discusses lessons in the visualization of these maps. We publish the code for our experiments and a website with our results.
* 10 pages
 Add to Chrome
 Add to Firefox
 Add to Edge