Identifying Subgroups of ICU Patients Using End-to-End Multivariate Time-Series Clustering Algorithm Based on Real-World Vital Signs Data
Paper and Code
Jun 03, 2023
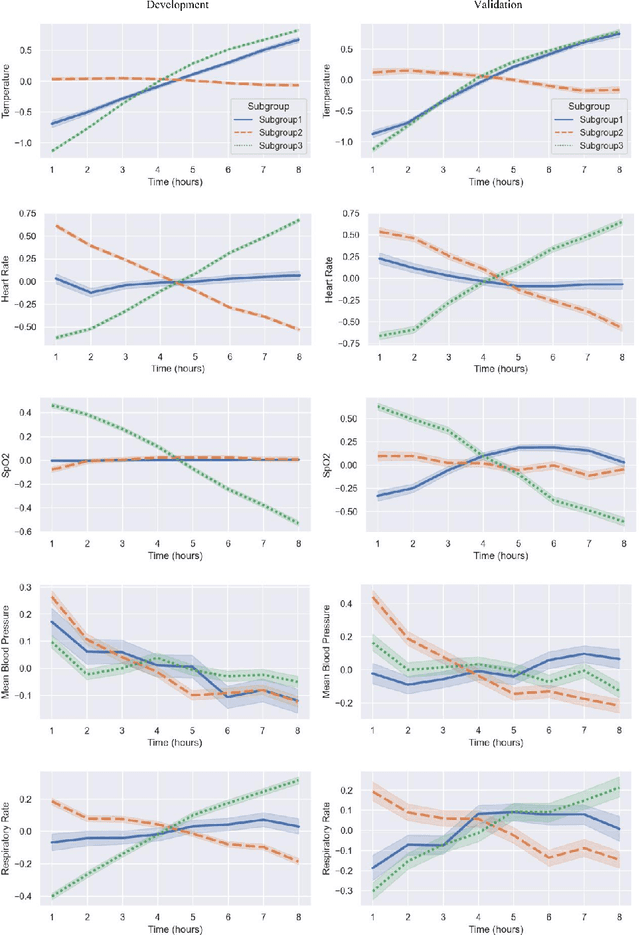
This study employed the MIMIC-IV database as data source to investigate the use of dynamic, high-frequency, multivariate time-series vital signs data, including temperature, heart rate, mean blood pressure, respiratory rate, and SpO2, monitored first 8 hours data in the ICU stay. Various clustering algorithms were compared, and an end-to-end multivariate time series clustering system called Time2Feat, combined with K-Means, was chosen as the most effective method to cluster patients in the ICU. In clustering analysis, data of 8,080 patients admitted between 2008 and 2016 was used for model development and 2,038 patients admitted between 2017 and 2019 for model validation. By analyzing the differences in clinical mortality prognosis among different categories, varying risks of ICU mortality and hospital mortality were found between different subgroups. Furthermore, the study visualized the trajectory of vital signs changes. The findings of this study provide valuable insights into the potential use of multivariate time-series clustering systems in patient management and monitoring in the ICU setting.
 Add to Chrome
 Add to Firefox
 Add to Edge