From Data to City Indicators: A Knowledge Graph for Supporting Automatic Generation of Dashboards
Paper and Code
Apr 06, 2017


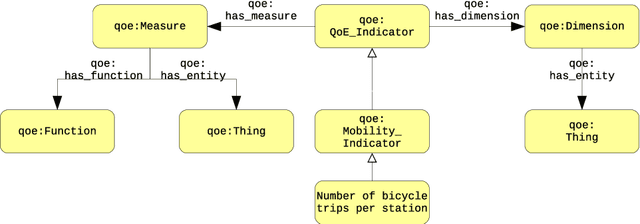
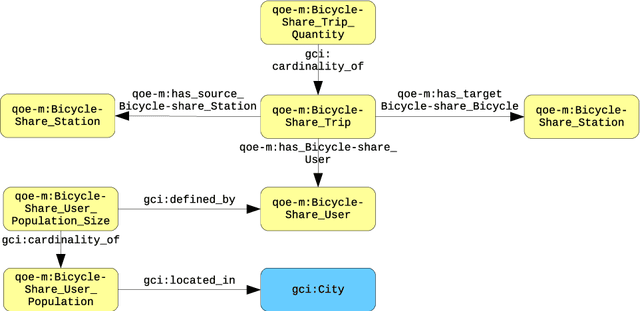
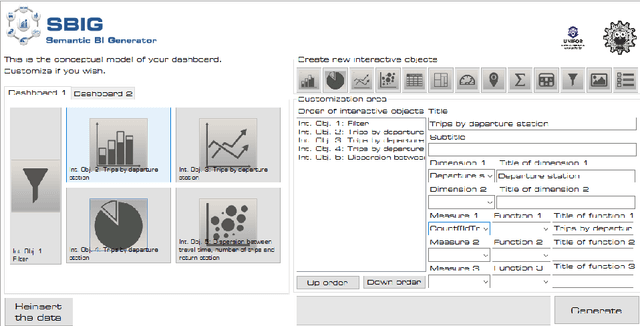
In the context of Smart Cities, indicator definitions have been used to calculate values that enable the comparison among different cities. The calculation of an indicator values has challenges as the calculation may need to combine some aspects of quality while addressing different levels of abstraction. Knowledge graphs (KGs) have been used successfully to support flexible representation, which can support improved understanding and data analysis in similar settings. This paper presents an operational description for a city KG, an indicator ontology that support indicator discovery and data visualization and an application capable of performing metadata analysis to automatically build and display dashboards according to discovered indicators. We describe our implementation in an urban mobility setting.
 Add to Chrome
 Add to Firefox
 Add to Edge