Analyzing the Noise Robustness of Deep Neural Networks
Paper and Code
Jan 26, 2020


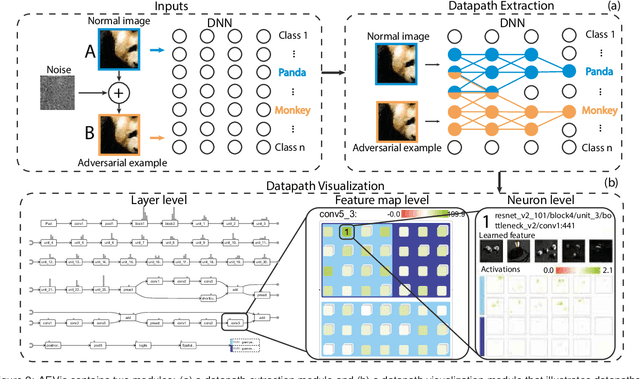
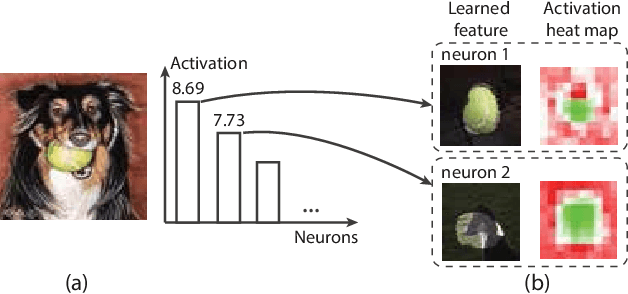
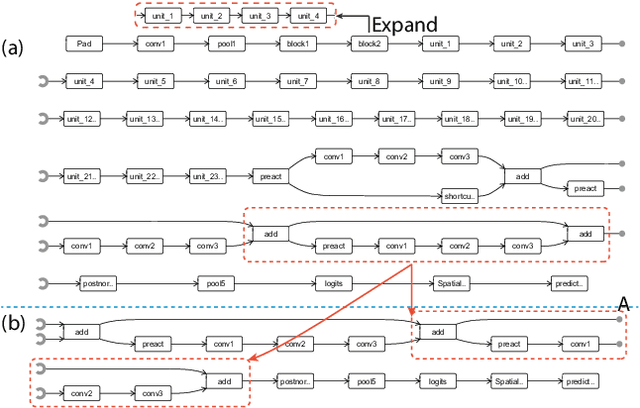
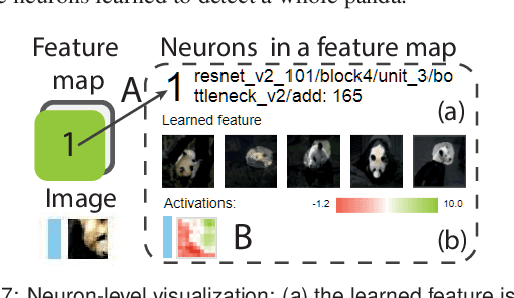
Adversarial examples, generated by adding small but intentionally imperceptible perturbations to normal examples, can mislead deep neural networks (DNNs) to make incorrect predictions. Although much work has been done on both adversarial attack and defense, a fine-grained understanding of adversarial examples is still lacking. To address this issue, we present a visual analysis method to explain why adversarial examples are misclassified. The key is to compare and analyze the datapaths of both the adversarial and normal examples. A datapath is a group of critical neurons along with their connections. We formulate the datapath extraction as a subset selection problem and solve it by constructing and training a neural network. A multi-level visualization consisting of a network-level visualization of data flows, a layer-level visualization of feature maps, and a neuron-level visualization of learned features, has been designed to help investigate how datapaths of adversarial and normal examples diverge and merge in the prediction process. A quantitative evaluation and a case study were conducted to demonstrate the promise of our method to explain the misclassification of adversarial examples.
 Add to Chrome
 Add to Firefox
 Add to Edge