Raphaël d'Andrimont
Boosting Crop Classification by Hierarchically Fusing Satellite, Rotational, and Contextual Data
May 25, 2023Abstract:Accurate in-season crop type classification is crucial for the crop production estimation and monitoring of agricultural parcels. However, the complexity of the plant growth patterns and their spatio-temporal variability present significant challenges. While current deep learning-based methods show promise in crop type classification from single- and multi-modal time series, most existing methods rely on a single modality, such as satellite optical remote sensing data or crop rotation patterns. We propose a novel approach to fuse multimodal information into a model for improved accuracy and robustness across multiple years and countries. The approach relies on three modalities used: remote sensing time series from Sentinel-2 and Landsat 8 observations, parcel crop rotation and local crop distribution. To evaluate our approach, we release a new annotated dataset of 7.4 million agricultural parcels in France and Netherlands. We associate each parcel with time-series of surface reflectance (Red and NIR) and biophysical variables (LAI, FAPAR). Additionally, we propose a new approach to automatically aggregate crop types into a hierarchical class structure for meaningful model evaluation and a novel data-augmentation technique for early-season classification. Performance of the multimodal approach was assessed at different aggregation level in the semantic domain spanning from 151 to 8 crop types or groups. It resulted in accuracy ranging from 91\% to 95\% for NL dataset and from 85\% to 89\% for FR dataset. Pre-training on a dataset improves domain adaptation between countries, allowing for cross-domain zero-shot learning, and robustness of the performances in a few-shot setting from France to Netherlands. Our proposed approach outperforms comparable methods by enabling learning methods to use the often overlooked spatio-temporal context of parcels, resulting in increased preci...
Skyline variations allow estimating distance to trees on landscape photos using semantic segmentation
Jan 14, 2022


Abstract:Approximate distance estimation can be used to determine fundamental landscape properties including complexity and openness. We show that variations in the skyline of landscape photos can be used to estimate distances to trees on the horizon. A methodology based on the variations of the skyline has been developed and used to investigate potential relationships with the distance to skyline objects. The skyline signal, defined by the skyline height expressed in pixels, was extracted for several Land Use/Cover Area frame Survey (LUCAS) landscape photos. Photos were semantically segmented with DeepLabV3+ trained with the Common Objects in Context (COCO) dataset. This provided pixel-level classification of the objects forming the skyline. A Conditional Random Fields (CRF) algorithm was also applied to increase the details of the skyline signal. Three metrics, able to capture the skyline signal variations, were then considered for the analysis. These metrics shows a functional relationship with distance for the class of trees, whose contours have a fractal nature. In particular, regression analysis was performed against 475 ortho-photo based distance measurements, and, in the best case, a R2 score equal to 0.47 was achieved. This is an encouraging result which shows the potential of skyline variation metrics for inferring distance related information.
Monitoring crop phenology with street-level imagery using computer vision
Dec 16, 2021


Abstract:Street-level imagery holds a significant potential to scale-up in-situ data collection. This is enabled by combining the use of cheap high quality cameras with recent advances in deep learning compute solutions to derive relevant thematic information. We present a framework to collect and extract crop type and phenological information from street level imagery using computer vision. During the 2018 growing season, high definition pictures were captured with side-looking action cameras in the Flevoland province of the Netherlands. Each month from March to October, a fixed 200-km route was surveyed collecting one picture per second resulting in a total of 400,000 geo-tagged pictures. At 220 specific parcel locations detailed on the spot crop phenology observations were recorded for 17 crop types. Furthermore, the time span included specific pre-emergence parcel stages, such as differently cultivated bare soil for spring and summer crops as well as post-harvest cultivation practices, e.g. green manuring and catch crops. Classification was done using TensorFlow with a well-known image recognition model, based on transfer learning with convolutional neural networks (MobileNet). A hypertuning methodology was developed to obtain the best performing model among 160 models. This best model was applied on an independent inference set discriminating crop type with a Macro F1 score of 88.1% and main phenological stage at 86.9% at the parcel level. Potential and caveats of the approach along with practical considerations for implementation and improvement are discussed. The proposed framework speeds up high quality in-situ data collection and suggests avenues for massive data collection via automated classification using computer vision.
From parcel to continental scale -- A first European crop type map based on Sentinel-1 and LUCAS Copernicus in-situ observations
May 21, 2021


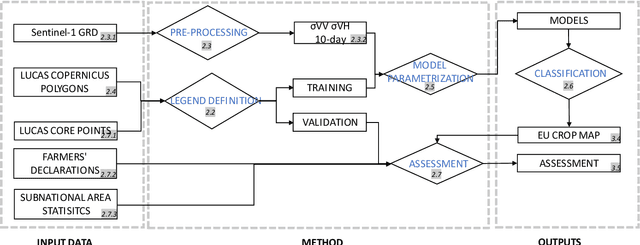
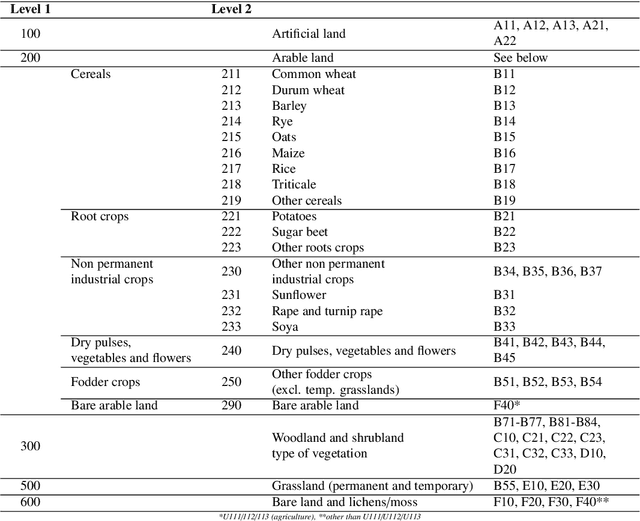
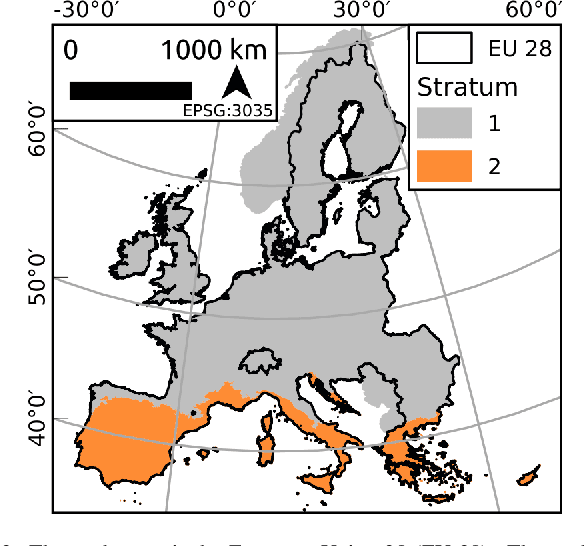
Abstract:Detailed parcel-level crop type mapping for the whole European Union (EU) is necessary for the evaluation of agricultural policies. The Copernicus program, and Sentinel-1 (S1) in particular, offers the opportunity to monitor agricultural land at a continental scale and in a timely manner. However, so far the potential of S1 has not been explored at such a scale. Capitalizing on the unique LUCAS 2018 Copernicus in-situ survey, we present the first continental crop type map at 10-m spatial resolution for the EU based on S1A and S1B Synthetic Aperture Radar observations for the year 2018. Random forest classification algorithms are tuned to detect 19 different crop types. We assess the accuracy of this EU crop map with three approaches. First, the accuracy is assessed with independent LUCAS core in-situ observations over the continent. Second, an accuracy assessment is done specifically for main crop types from farmers declarations from 6 EU member countries or regions totaling >3M parcels and 8.21 Mha. Finally, the crop areas derived by classification are compared to the subnational (NUTS 2) area statistics reported by Eurostat. The overall accuracy for the map is reported as 80.3% when grouping main crop classes and 76% when considering all 19 crop type classes separately. Highest accuracies are obtained for rape and turnip rape with user and produced accuracies higher than 96%. The correlation between the remotely sensed estimated and Eurostat reported crop area ranges from 0.93 (potatoes) to 0.99 (rape and turnip rape). Finally, we discuss how the framework presented here can underpin the operational delivery of in-season high-resolution based crop mapping.
 Add to Chrome
 Add to Firefox
 Add to Edge