 Add to Chrome
 Add to Firefox
 Add to Edge
Mitigating the Multiplicity Burden: The Role of Calibration in Reducing Predictive Multiplicity of Classifiers
Mar 12, 2026As machine learning models are increasingly deployed in high-stakes environments, ensuring both probabilistic reliability and prediction stability has become critical. This paper examines the interplay between classification calibration and predictive multiplicity - the phenomenon in which multiple near-optimal models within the Rashomon set yield conflicting credit outcomes for the same applicant. Using nine diverse credit risk benchmark datasets, we investigate whether predictive multiplicity concentrates in regions of low predictive confidence and how post-hoc calibration can mitigate algorithmic arbitrariness. Our empirical analysis reveals that minority class observations bear a disproportionate multiplicity burden, as confirmed by significant disparities in predictive multiplicity and prediction confidence. Furthermore, our empirical comparisons indicate that applying post-hoc calibration methods - specifically Platt Scaling, Isotonic Regression, and Temperature Scaling - is associated with lower obscurity across the Rashomon set. Among the tested techniques, Platt Scaling and Isotonic Regression provide the most robust reduction in predictive multiplicity. These findings suggest that calibration can function as a consensus-enforcing layer and may support procedural fairness by mitigating predictive multiplicity.
Decomposing Observational Multiplicity in Decision Trees: Leaf and Structural Regret
Mar 12, 2026Many machine learning tasks admit multiple models that perform almost equally well, a phenomenon known as predictive multiplicity. A fundamental source of this multiplicity is observational multiplicity, which arises from the stochastic nature of label collection: observed training labels represent only a single realization of the underlying ground-truth probabilities. While theoretical frameworks for observational multiplicity have been established for logistic regression, their implications for non-smooth, partition-based models like decision trees remain underexplored. In this paper, we introduce two complementary notions of observational multiplicity for decision tree classifiers: leaf regret and structural regret. Leaf regret quantifies the intrinsic variability of predictions within a fixed leaf due to finite-sample noise, while structural regret captures variability induced by the instability of the learned tree structure itself. We provide a formal decomposition of observational multiplicity into these two components and establish statistical guarantees. Our experimental evaluation across diverse credit risk scoring datasets confirms the near-perfect alignment between our theoretical decomposition and the empirically observed variance. Notably, we find that structural regret is the primary driver of observational multiplicity, accounting for over 15 times the variability of leaf regret in some datasets. Furthermore, we demonstrate that utilizing these regret measures as an abstention mechanism in selective prediction can effectively identify arbitrary regions and improve model safety, elevating recall from 92% to 100% on the most stable sub-populations. These results establish a rigorous framework for quantifying observational multiplicity, aligning with recent advances in algorithmic safety and interpretability.
Analyzing the Temporal Factors for Anxiety and Depression Symptoms with the Rashomon Perspective
Jan 18, 2026This paper introduces a new modeling perspective in the public mental health domain to provide a robust interpretation of the relations between anxiety and depression, and the demographic and temporal factors. This perspective particularly leverages the Rashomon Effect, where multiple models exhibit similar predictive performance but rely on diverse internal structures. Instead of considering these multiple models, choosing a single best model risks masking alternative narratives embedded in the data. To address this, we employed this perspective in the interpretation of a large-scale psychological dataset, specifically focusing on the Patient Health Questionnaire-4. We use a random forest model combined with partial dependence profiles to rigorously assess the robustness and stability of predictive relationships across the resulting Rashomon set, which consists of multiple models that exhibit similar predictive performance. Our findings confirm that demographic variables \texttt{age}, \texttt{sex}, and \texttt{education} lead to consistent structural shifts in anxiety and depression risk. Crucially, we identify significant temporal effects: risk probability demonstrates clear diurnal and circaseptan fluctuations, peaking during early morning hours. This work demonstrates the necessity of moving beyond the best model to analyze the entire Rashomon set. Our results highlight that the observed variability, particularly due to circadian and circaseptan rhythms, must be meticulously considered for robust interpretation in psychological screening. We advocate for a multiplicity-aware approach to enhance the stability and generalizability of ML-based conclusions in mental health research.
On the Tunability of Random Survival Forests Model for Predictive Maintenance
Apr 20, 2025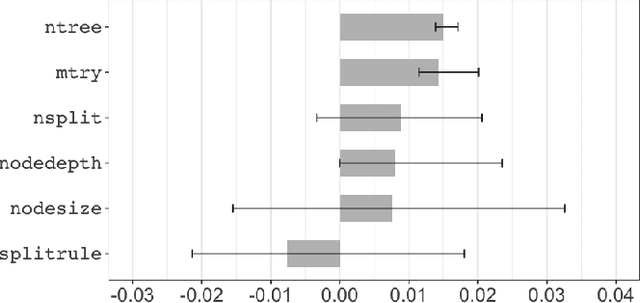
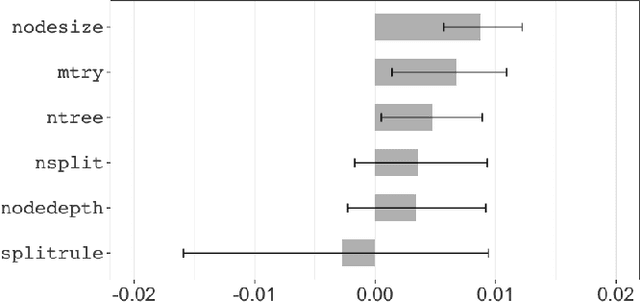
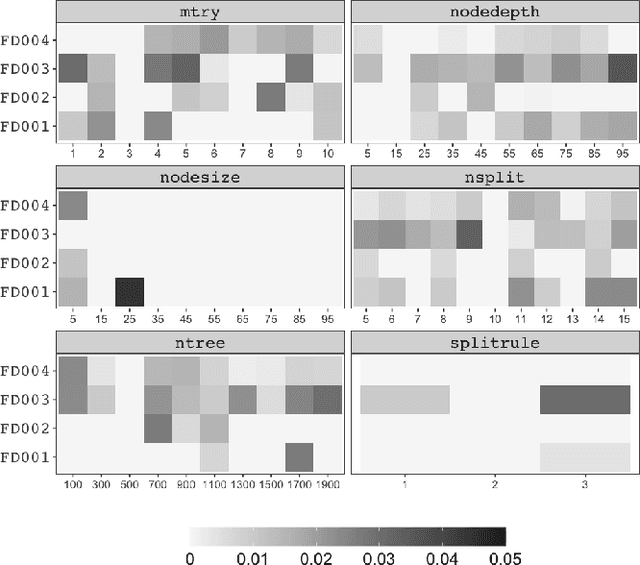

This paper investigates the tunability of the Random Survival Forest (RSF) model in predictive maintenance, where accurate time-to-failure estimation is crucial. Although RSF is widely used due to its flexibility and ability to handle censored data, its performance is sensitive to hyperparameter configurations. However, systematic evaluations of RSF tunability remain limited, especially in predictive maintenance contexts. We introduce a three-level framework to quantify tunability: (1) a model-level metric measuring overall performance gain from tuning, (2) a hyperparameter-level metric assessing individual contributions, and (3) identification of optimal tuning ranges. These metrics are evaluated across multiple datasets using survival-specific criteria: the C-index for discrimination and the Brier score for calibration. Experiments on four CMAPSS dataset subsets, simulating aircraft engine degradation, reveal that hyperparameter tuning consistently improves model performance. On average, the C-index increased by 0.0547, while the Brier score decreased by 0.0199. These gains were consistent across all subsets. Moreover, ntree and mtry showed the highest average tunability, while nodesize offered stable improvements within the range of 10 to 30. In contrast, splitrule demonstrated negative tunability on average, indicating that improper tuning may reduce model performance. Our findings emphasize the practical importance of hyperparameter tuning in survival models and provide actionable insights for optimizing RSF in real-world predictive maintenance applications.
Predictive Multiplicity in Survival Models: A Method for Quantifying Model Uncertainty in Predictive Maintenance Applications
Apr 16, 2025


In many applications, especially those involving prediction, models may yield near-optimal performance yet significantly disagree on individual-level outcomes. This phenomenon, known as predictive multiplicity, has been formally defined in binary, probabilistic, and multi-target classification, and undermines the reliability of predictive systems. However, its implications remain unexplored in the context of survival analysis, which involves estimating the time until a failure or similar event while properly handling censored data. We frame predictive multiplicity as a critical concern in survival-based models and introduce formal measures -- ambiguity, discrepancy, and obscurity -- to quantify it. This is particularly relevant for downstream tasks such as maintenance scheduling, where precise individual risk estimates are essential. Understanding and reporting predictive multiplicity helps build trust in models deployed in high-stakes environments. We apply our methodology to benchmark datasets from predictive maintenance, extending the notion of multiplicity to survival models. Our findings show that ambiguity steadily increases, reaching up to 40-45% of observations; discrepancy is lower but exhibits a similar trend; and obscurity remains mild and concentrated in a few models. These results demonstrate that multiple accurate survival models may yield conflicting estimations of failure risk and degradation progression for the same equipment. This highlights the need to explicitly measure and communicate predictive multiplicity to ensure reliable decision-making in process health management.
datadriftR: An R Package for Concept Drift Detection in Predictive Models
Dec 15, 2024


Predictive models often face performance degradation due to evolving data distributions, a phenomenon known as data drift. Among its forms, concept drift, where the relationship between explanatory variables and the response variable changes, is particularly challenging to detect and adapt to. Traditional drift detection methods often rely on metrics such as accuracy or variable distributions, which may fail to capture subtle but significant conceptual changes. This paper introduces drifter, an R package designed to detect concept drift, and proposes a novel method called Profile Drift Detection (PDD) that enables both drift detection and an enhanced understanding of the cause behind the drift by leveraging an explainable AI tool - Partial Dependence Profiles (PDPs). The PDD method, central to the package, quantifies changes in PDPs through novel metrics, ensuring sensitivity to shifts in the data stream without excessive computational costs. This approach aligns with MLOps practices, emphasizing model monitoring and adaptive retraining in dynamic environments. The experiments across synthetic and real-world datasets demonstrate that PDD outperforms existing methods by maintaining high accuracy while effectively balancing sensitivity and stability. The results highlight its capability to adaptively retrain models in dynamic environments, making it a robust tool for real-time applications. The paper concludes by discussing the advantages, limitations, and future extensions of the package for broader use cases.
Investigating the Impact of Balancing, Filtering, and Complexity on Predictive Multiplicity: A Data-Centric Perspective
Dec 12, 2024


The Rashomon effect presents a significant challenge in model selection. It occurs when multiple models achieve similar performance on a dataset but produce different predictions, resulting in predictive multiplicity. This is especially problematic in high-stakes environments, where arbitrary model outcomes can have serious consequences. Traditional model selection methods prioritize accuracy and fail to address this issue. Factors such as class imbalance and irrelevant variables further complicate the situation, making it harder for models to provide trustworthy predictions. Data-centric AI approaches can mitigate these problems by prioritizing data optimization, particularly through preprocessing techniques. However, recent studies suggest preprocessing methods may inadvertently inflate predictive multiplicity. This paper investigates how data preprocessing techniques like balancing and filtering methods impact predictive multiplicity and model stability, considering the complexity of the data. We conduct the experiments on 21 real-world datasets, applying various balancing and filtering techniques, and assess the level of predictive multiplicity introduced by these methods by leveraging the Rashomon effect. Additionally, we examine how filtering techniques reduce redundancy and enhance model generalization. The findings provide insights into the relationship between balancing methods, data complexity, and predictive multiplicity, demonstrating how data-centric AI strategies can improve model performance.
An effect analysis of the balancing techniques on the counterfactual explanations of student success prediction models
Aug 01, 2024

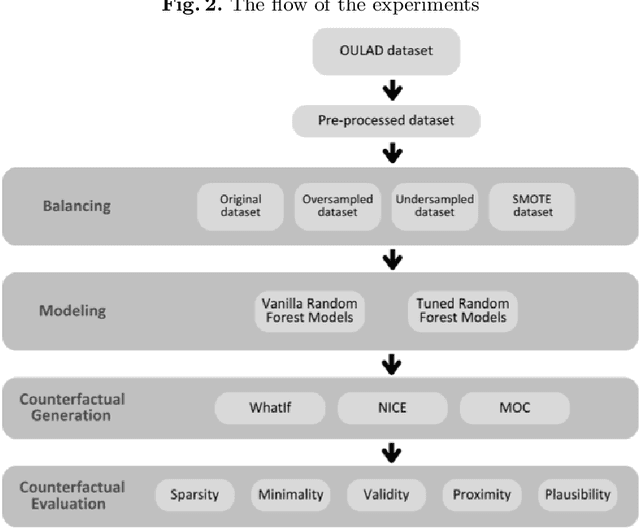

In the past decade, we have experienced a massive boom in the usage of digital solutions in higher education. Due to this boom, large amounts of data have enabled advanced data analysis methods to support learners and examine learning processes. One of the dominant research directions in learning analytics is predictive modeling of learners' success using various machine learning methods. To build learners' and teachers' trust in such methods and systems, exploring the methods and methodologies that enable relevant stakeholders to deeply understand the underlying machine-learning models is necessary. In this context, counterfactual explanations from explainable machine learning tools are promising. Several counterfactual generation methods hold much promise, but the features must be actionable and causal to be effective. Thus, obtaining which counterfactual generation method suits the student success prediction models in terms of desiderata, stability, and robustness is essential. Although a few studies have been published in recent years on the use of counterfactual explanations in educational sciences, they have yet to discuss which counterfactual generation method is more suitable for this problem. This paper analyzed the effectiveness of commonly used counterfactual generation methods, such as WhatIf Counterfactual Explanations, Multi-Objective Counterfactual Explanations, and Nearest Instance Counterfactual Explanations after balancing. This contribution presents a case study using the Open University Learning Analytics dataset to demonstrate the practical usefulness of counterfactual explanations. The results illustrate the method's effectiveness and describe concrete steps that could be taken to alter the model's prediction.
Explainable bank failure prediction models: Counterfactual explanations to reduce the failure risk
Jul 14, 2024


The accuracy and understandability of bank failure prediction models are crucial. While interpretable models like logistic regression are favored for their explainability, complex models such as random forest, support vector machines, and deep learning offer higher predictive performance but lower explainability. These models, known as black boxes, make it difficult to derive actionable insights. To address this challenge, using counterfactual explanations is suggested. These explanations demonstrate how changes in input variables can alter the model output and suggest ways to mitigate bank failure risk. The key challenge lies in selecting the most effective method for generating useful counterfactuals, which should demonstrate validity, proximity, sparsity, and plausibility. The paper evaluates several counterfactual generation methods: WhatIf, Multi Objective, and Nearest Instance Counterfactual Explanation, and also explores resampling methods like undersampling, oversampling, SMOTE, and the cost sensitive approach to address data imbalance in bank failure prediction in the US. The results indicate that the Nearest Instance Counterfactual Explanation method yields higher quality counterfactual explanations, mainly using the cost sensitive approach. Overall, the Multi Objective Counterfactual and Nearest Instance Counterfactual Explanation methods outperform others regarding validity, proximity, and sparsity metrics, with the cost sensitive approach providing the most desirable counterfactual explanations. These findings highlight the variability in the performance of counterfactual generation methods across different balancing strategies and machine learning models, offering valuable strategies to enhance the utility of black box bank failure prediction models.
Glocal Explanations of Expected Goal Models in Soccer
Aug 29, 2023


The expected goal models have gained popularity, but their interpretability is often limited, especially when trained using black-box methods. Explainable artificial intelligence tools have emerged to enhance model transparency and extract descriptive knowledge for a single observation or for all observations. However, explaining black-box models for a specific group of observations may be more useful in some domains. This paper introduces the glocal explanations (between local and global levels) of the expected goal models to enable performance analysis at the team and player levels by proposing the use of aggregated versions of the SHAP values and partial dependence profiles. This allows knowledge to be extracted from the expected goal model for a player or team rather than just a single shot. In addition, we conducted real-data applications to illustrate the usefulness of aggregated SHAP and aggregated profiles. The paper concludes with remarks on the potential of these explanations for performance analysis in soccer analytics.