 Add to Chrome
 Add to Firefox
 Add to Edge
Cardiac mortality prediction in patients undergoing PCI based on real and synthetic data
Dec 24, 2025Patient status, angiographic and procedural characteristics encode crucial signals for predicting long-term outcomes after percutaneous coronary intervention (PCI). The aim of the study was to develop a predictive model for assessing the risk of cardiac death based on the real and synthetic data of patients undergoing PCI and to identify the factors that have the greatest impact on mortality. We analyzed 2,044 patients, who underwent a PCI for bifurcation lesions. The primary outcome was cardiac death at 3-year follow-up. Several machine learning models were applied to predict three-year mortality after PCI. To address class imbalance and improve the representation of the minority class, an additional 500 synthetic samples were generated and added to the training set. To evaluate the contribution of individual features to model performance, we applied permutation feature importance. An additional experiment was conducted to evaluate how the model's predictions would change after removing non-informative features from the training and test datasets. Without oversampling, all models achieve high overall accuracy (0.92-0.93), yet they almost completely ignore the minority class. Across models, augmentation consistently increases minority-class recall with minimal loss of AUROC, improves probability quality, and yields more clinically reasonable risk estimates on the constructed severe profiles. According to feature importance analysis, four features emerged as the most influential: Age, Ejection Fraction, Peripheral Artery Disease, and Cerebrovascular Disease. These results show that straightforward augmentation with realistic and extreme cases can expose, quantify, and reduce brittleness in imbalanced clinical prediction using only tabular records, and motivate routine reporting of probability quality and stress tests alongside headline metrics.
Symbolic regression for defect interactions in 2D materials
Dec 23, 2025Machine learning models have become firmly established across all scientific fields. Extracting features from data and making inferences based on them with neural network models often yields high accuracy; however, this approach has several drawbacks. Symbolic regression is a powerful technique for discovering analytical equations that describe data, providing interpretable and generalizable models capable of predicting unseen data. Symbolic regression methods have gained new momentum with the advancement of neural network technologies and offer several advantages, the main one being the interpretability of results. In this work, we examined the application of the deep symbolic regression algorithm SEGVAE to determine the properties of two-dimensional materials with defects. Comparing the results with state-of-the-art graph neural network-based methods shows comparable or, in some cases, even identical outcomes. We also discuss the applicability of this class of methods in natural sciences.
Symbolic expression generation via Variational Auto-Encoder
Jan 15, 2023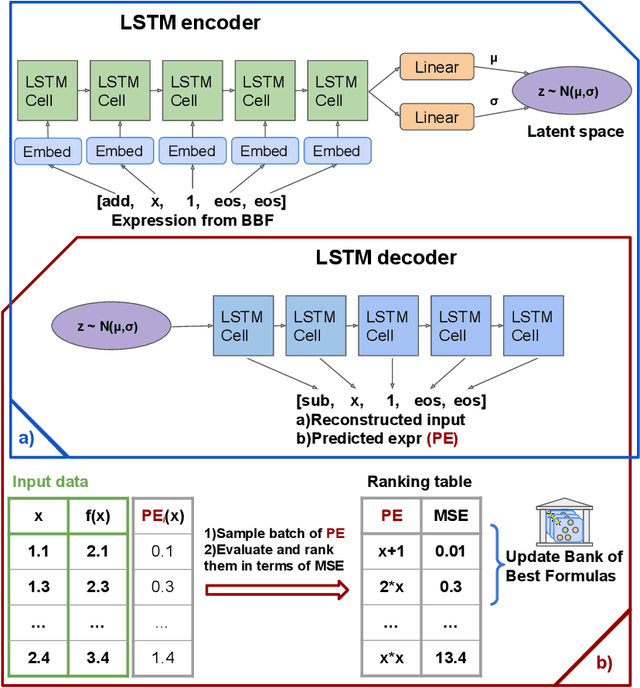
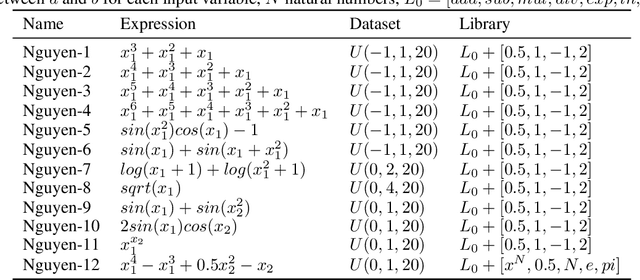
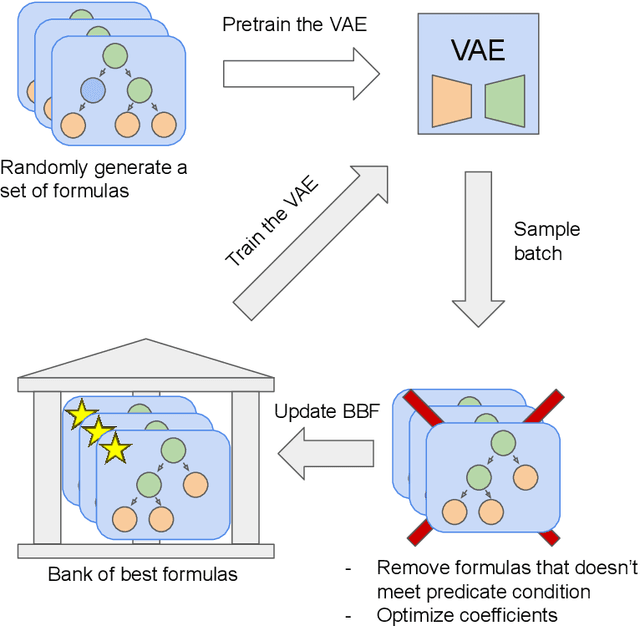
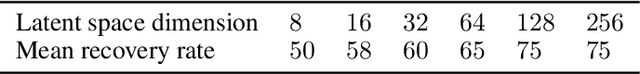
There are many problems in physics, biology, and other natural sciences in which symbolic regression can provide valuable insights and discover new laws of nature. A widespread Deep Neural Networks do not provide interpretable solutions. Meanwhile, symbolic expressions give us a clear relation between observations and the target variable. However, at the moment, there is no dominant solution for the symbolic regression task, and we aim to reduce this gap with our algorithm. In this work, we propose a novel deep learning framework for symbolic expression generation via variational autoencoder (VAE). In a nutshell, we suggest using a VAE to generate mathematical expressions, and our training strategy forces generated formulas to fit a given dataset. Our framework allows encoding apriori knowledge of the formulas into fast-check predicates that speed up the optimization process. We compare our method to modern symbolic regression benchmarks and show that our method outperforms the competitors under noisy conditions. The recovery rate of SEGVAE is 65% on the Ngyuen dataset with a noise level of 10%, which is better than the previously reported SOTA by 20%. We demonstrate that this value depends on the dataset and can be even higher.