Md Sami Hasnine
Community-based Behavioral Understanding of Crisis Activity Concerns using Social Media Data: A Study on the 2023 Canadian Wildfires in New York City
Jan 22, 2024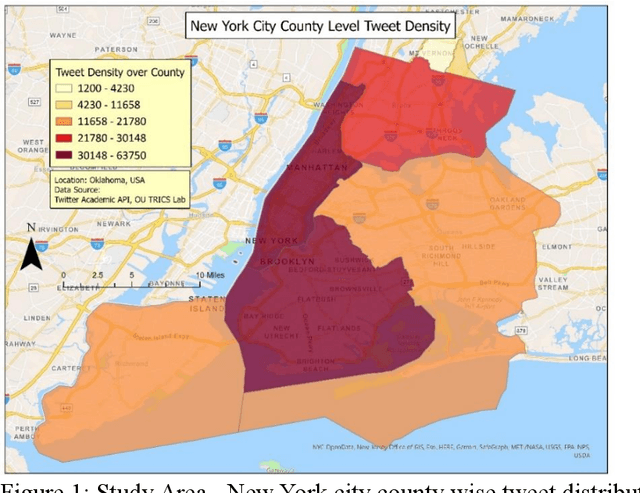
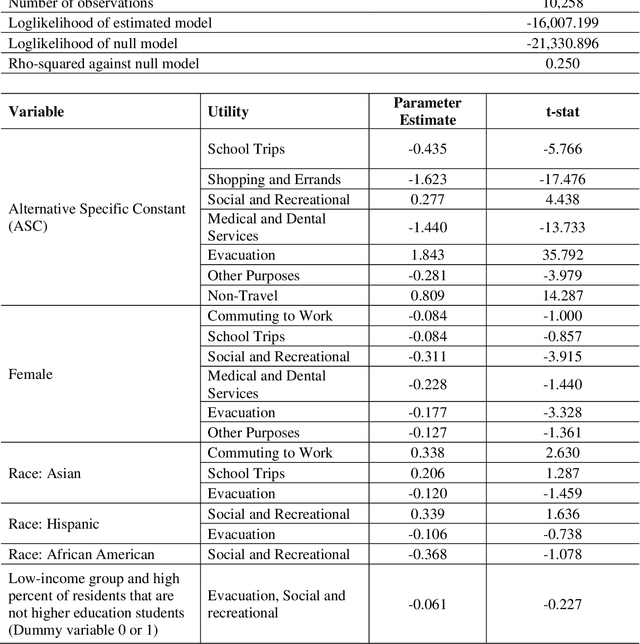
Abstract:New York City (NYC) topped the global chart for the worst air pollution in June 2023, owing to the wildfire smoke drifting in from Canada. This unprecedented situation caused significant travel disruptions and shifts in traditional activity patterns of NYC residents. This study utilized large-scale social media data to study different crisis activity concerns (i.e., evacuation, staying indoors, shopping, and recreational activities among others) in the emergence of the 2023 Canadian wildfire smoke in NYC. In this regard, one week (June 02 through June 09, 2023) geotagged Twitter data from NYC were retrieved and used in the analysis. The tweets were processed using advanced text classification techniques and later integrated with national databases such as Social Security Administration data, Census, and American Community Survey. Finally, a model has been developed to make community inferences of different activity concerns in a major wildfire. The findings suggest, during wildfires, females are less likely to engage in discussions about evacuation, trips for medical, social, or recreational purposes, and commuting for work, likely influenced by workplaces maintaining operations despite poor air quality. There were also racial disparities in these discussions, with Asians being more likely than Hispanics to discuss evacuation and work commute, and African Americans being less likely to discuss social and recreational activities. Additionally, individuals from low-income neighborhoods and non-higher education students expressed fewer concerns about evacuation. This study provides valuable insights for policymakers, emergency planners, and public health officials, aiding them in formulating targeted communication strategies and equitable emergency response plans.
Leveraging Social Media Data to Identify Factors Influencing Public Attitude Towards Accessibility, Socioeconomic Disparity and Public Transportation
Jan 22, 2024

Abstract:This study proposes a novel method to understand the factors affecting individuals' perception of transport accessibility, socioeconomic disparity, and public infrastructure. As opposed to the time consuming and expensive survey-based approach, this method can generate organic large-scale responses from social media and develop statistical models to understand individuals' perceptions of various transportation issues. This study retrieved and analyzed 36,098 tweets from New York City from March 19, 2020, to May 15, 2022. A state-of-the-art natural language processing algorithm is used for text mining and classification. A data fusion technique has been adopted to generate a series of socioeconomic traits that are used as explanatory variables in the model. The model results show that females and individuals of Asian origin tend to discuss transportation accessibility more than their counterparts, with those experiencing high neighborhood traffic also being more vocal. However, disadvantaged individuals, including the unemployed and those living in low-income neighborhoods or in areas with high natural hazard risks, tend to communicate less about such issues. As for socioeconomic disparity, individuals of Asian origin and those experiencing various types of air pollution are more likely to discuss these topics on Twitter, often with a negative sentiment. However, unemployed, or disadvantaged individuals, as well as those living in areas with high natural hazard risks or expected losses, are less inclined to tweet about this subject. Lack of internet accessibility could be a reason why many disadvantaged individuals do not tweet about transport accessibility and subsidized internet could be a possible solution.
An Interpretable Machine Learning Framework to Understand Bikeshare Demand before and during the COVID-19 Pandemic in New York City
Nov 10, 2023Abstract:In recent years, bikesharing systems have become increasingly popular as affordable and sustainable micromobility solutions. Advanced mathematical models such as machine learning are required to generate good forecasts for bikeshare demand. To this end, this study proposes a machine learning modeling framework to estimate hourly demand in a large-scale bikesharing system. Two Extreme Gradient Boosting models were developed: one using data from before the COVID-19 pandemic (March 2019 to February 2020) and the other using data from during the pandemic (March 2020 to February 2021). Furthermore, a model interpretation framework based on SHapley Additive exPlanations was implemented. Based on the relative importance of the explanatory variables considered in this study, share of female users and hour of day were the two most important explanatory variables in both models. However, the month variable had higher importance in the pandemic model than in the pre-pandemic model.
 Add to Chrome
 Add to Firefox
 Add to Edge