Manish Tanwar
VizAI : Selecting Accurate Visualizations of Numerical Data
Nov 07, 2021


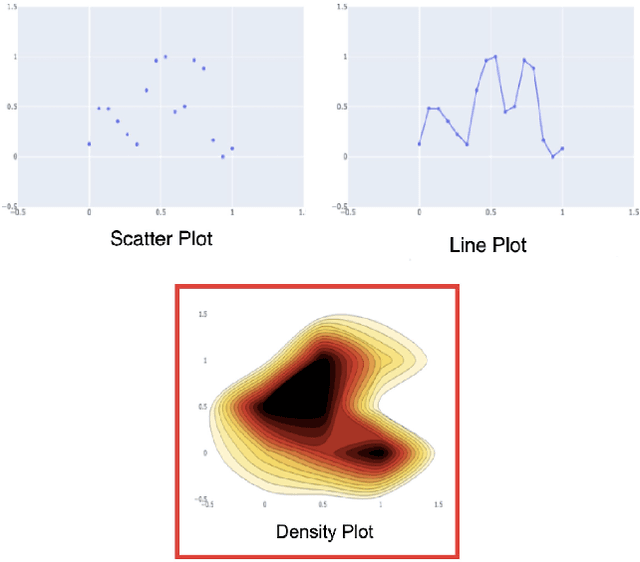
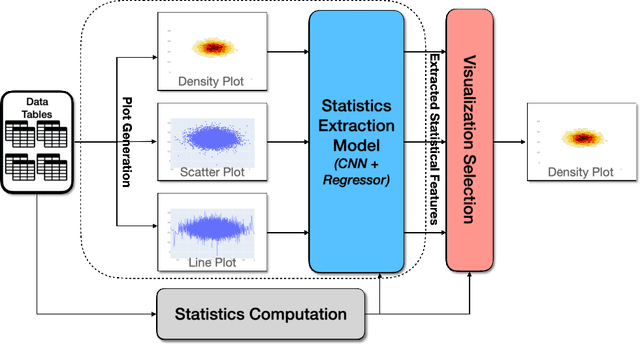
Abstract:A good data visualization is not only a distortion-free graphical representation of data but also a way to reveal underlying statistical properties of the data. Despite its common use across various stages of data analysis, selecting a good visualization often is a manual process involving many iterations. Recently there has been interest in reducing this effort by developing models that can recommend visualizations, but they are of limited use since they require large training samples (data and visualization pairs) and focus primarily on the design aspects rather than on assessing the effectiveness of the selected visualization. In this paper, we present VizAI, a generative-discriminative framework that first generates various statistical properties of the data from a number of alternative visualizations of the data. It is linked to a discriminative model that selects the visualization that best matches the true statistics of the data being visualized. VizAI can easily be trained with minimal supervision and adapts to settings with varying degrees of supervision easily. Using crowd-sourced judgements and a large repository of publicly available visualizations, we demonstrate that VizAI outperforms the state of the art methods that learn to recommend visualizations.
 Add to Chrome
 Add to Firefox
 Add to Edge