Loann Giovannangeli
FORBID: Fast Overlap Removal By stochastic gradIent Descent for Graph Drawing
Aug 19, 2022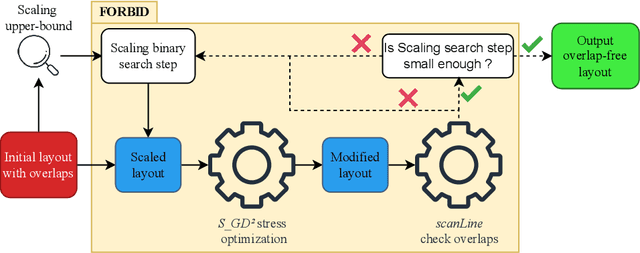
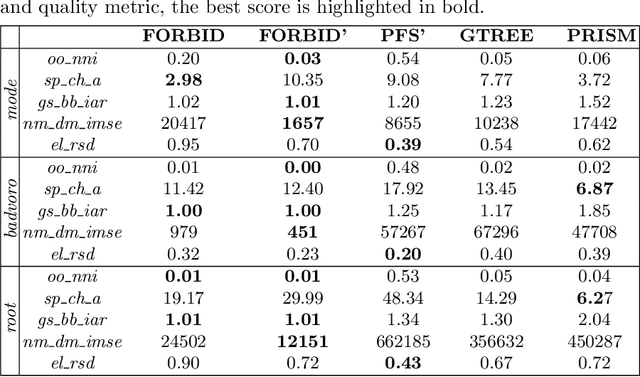
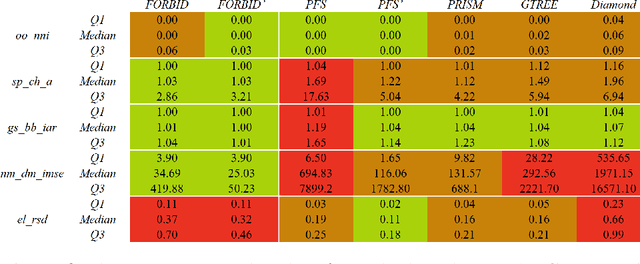

Abstract:While many graph drawing algorithms consider nodes as points, graph visualization tools often represent them as shapes. These shapes support the display of information such as labels or encode various data with size or color. However, they can create overlaps between nodes which hinder the exploration process by hiding parts of the information. It is therefore of utmost importance to remove these overlaps to improve graph visualization readability. If not handled by the layout process, Overlap Removal (OR) algorithms have been proposed as layout post-processing. As graph layouts usually convey information about their topology, it is important that OR algorithms preserve them as much as possible. We propose a novel algorithm that models OR as a joint stress and scaling optimization problem, and leverages efficient stochastic gradient descent. This approach is compared with state-of-the-art algorithms, and several quality metrics demonstrate its efficiency to quickly remove overlaps while retaining the initial layout structures.
Deep Neural Network for DrawiNg Networks, ^2
Aug 10, 2021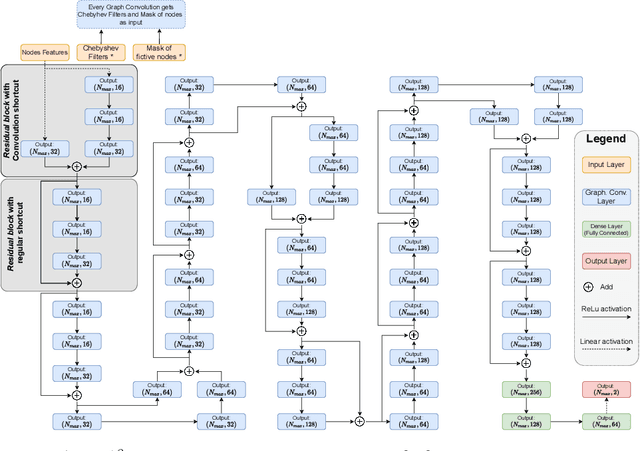

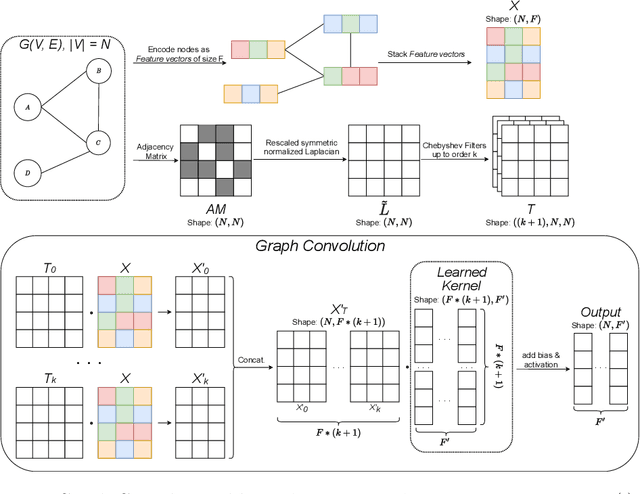

Abstract:By leveraging recent progress of stochastic gradient descent methods, several works have shown that graphs could be efficiently laid out through the optimization of a tailored objective function. In the meantime, Deep Learning (DL) techniques achieved great performances in many applications. We demonstrate that it is possible to use DL techniques to learn a graph-to-layout sequence of operations thanks to a graph-related objective function. In this paper, we present a novel graph drawing framework called (DNN)^2: Deep Neural Network for DrawiNg Networks. Our method uses Graph Convolution Networks to learn a model. Learning is achieved by optimizing a graph topology related loss function that evaluates (DNN)^2 generated layouts during training. Once trained, the (DNN)^ model is able to quickly lay any input graph out. We experiment (DNN)^2 and statistically compare it to optimization-based and regular graph layout algorithms. The results show that (DNN)^2 performs well and are encouraging as the Deep Learning approach to Graph Drawing is novel and many leads for future works are identified.
Impacts of the Numbers of Colors and Shapes on Outlier Detection: from Automated to User Evaluation
Mar 10, 2021
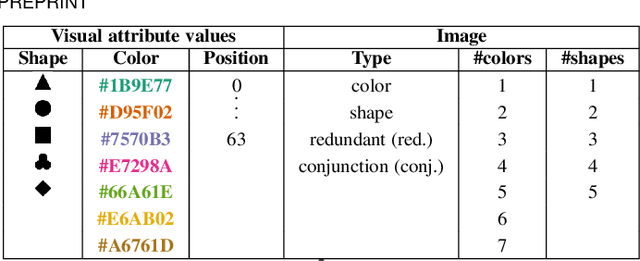
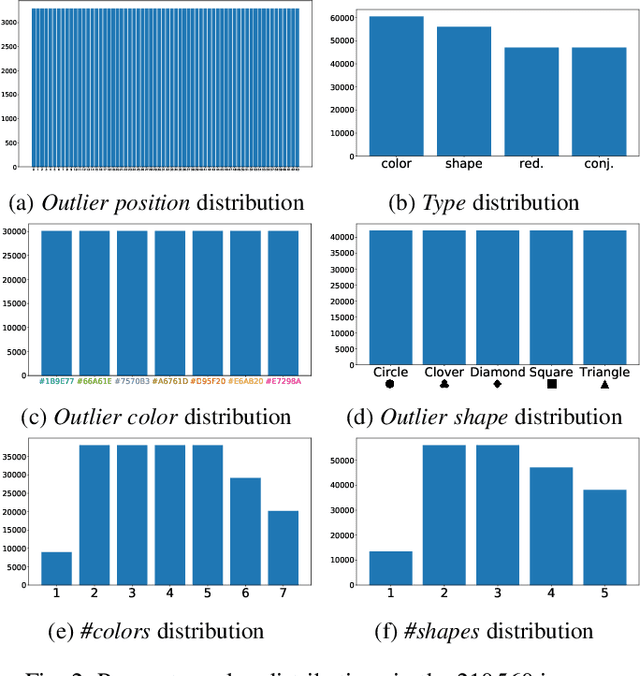
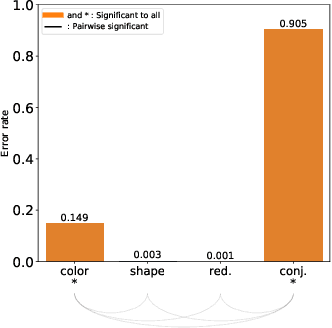
Abstract:The design of efficient representations is well established as a fruitful way to explore and analyze complex or large data. In these representations, data are encoded with various visual attributes depending on the needs of the representation itself. To make coherent design choices about visual attributes, the visual search field proposes guidelines based on the human brain perception of features. However, information visualization representations frequently need to depict more data than the amount these guidelines have been validated on. Since, the information visualization community has extended these guidelines to a wider parameter space. This paper contributes to this theme by extending visual search theories to an information visualization context. We consider a visual search task where subjects are asked to find an unknown outlier in a grid of randomly laid out distractor. Stimuli are defined by color and shape features for the purpose of visually encoding categorical data. The experimental protocol is made of a parameters space reduction step (i.e., sub-sampling) based on a machine learning model, and a user evaluation to measure capacity limits and validate hypotheses. The results show that the major difficulty factor is the number of visual attributes that are used to encode the outlier. When redundantly encoded, the display heterogeneity has no effect on the task. When encoded with one attribute, the difficulty depends on that attribute heterogeneity until its capacity limit (7 for color, 5 for shape) is reached. Finally, when encoded with two attributes simultaneously, performances drop drastically even with minor heterogeneity.
 Add to Chrome
 Add to Firefox
 Add to Edge