 Add to Chrome
 Add to Firefox
 Add to Edge
Multivariate Temporal Regression at Scale: A Three-Pillar Framework Combining ML, XAI, and NLP
Apr 02, 2025


The rapid use of artificial intelligence (AI) in processes such as coding, image processing, and data prediction means it is crucial to understand and validate the data we are working with fully. This paper dives into the hurdles of analyzing high-dimensional data, especially when it gets too complex. Traditional methods in data analysis often look at direct connections between input variables, which can miss out on the more complicated relationships within the data. To address these issues, we explore several tested techniques, such as removing specific variables to see their impact and using statistical analysis to find connections between multiple variables. We also consider the role of synthetic data and how information can sometimes be redundant across different sensors. These analyses are typically very computationally demanding and often require much human effort to make sense of the results. A common approach is to treat the entire dataset as one unit and apply advanced models to handle it. However, this can become problematic with larger, noisier datasets and more complex models. So, we suggest methods to identify overall patterns that can help with tasks like classification or regression based on the idea that more straightforward approaches might be more understandable. Our research looks at two datasets: a real-world dataset and a synthetic one. The goal is to create a methodology that highlights key features on a global scale that lead to predictions, making it easier to validate or quantify the data set. By reducing the dimensionality with this method, we can simplify the models used and thus clarify the insights we gain. Furthermore, our method can reveal unexplored relationships between specific inputs and outcomes, providing a way to validate these new connections further.
Pattern Based Multivariable Regression using Deep Learning (PBMR-DP)
Mar 09, 2022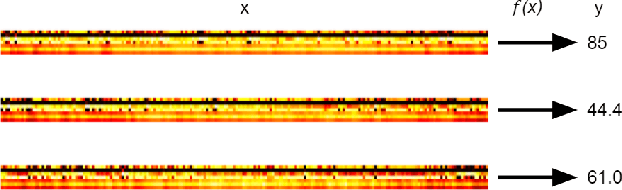
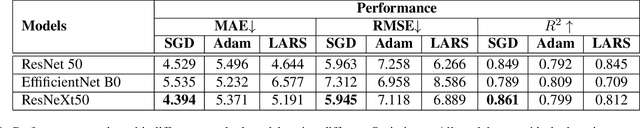
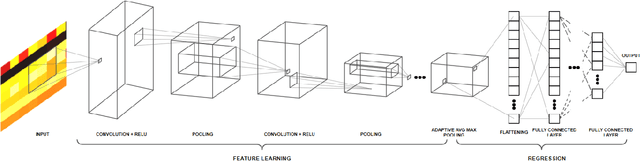
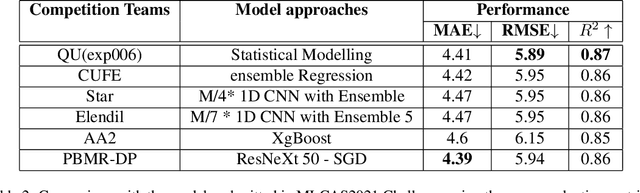
We propose a deep learning methodology for multivariate regression that is based on pattern recognition that triggers fast learning over sensor data. We used a conversion of sensors-to-image which enables us to take advantage of Computer Vision architectures and training processes. In addition to this data preparation methodology, we explore the use of state-of-the-art architectures to generate regression outputs to predict agricultural crop continuous yield information. Finally, we compare with some of the top models reported in MLCAS2021. We found that using a straightforward training process, we were able to accomplish an MAE of 4.394, RMSE of 5.945, and R^2 of 0.861.