Hyungeun Lee
Hierarchical Joint Graph Learning and Multivariate Time Series Forecasting
Nov 30, 2023Abstract:Multivariate time series is prevalent in many scientific and industrial domains. Modeling multivariate signals is challenging due to their long-range temporal dependencies and intricate interactions--both direct and indirect. To confront these complexities, we introduce a method of representing multivariate signals as nodes in a graph with edges indicating interdependency between them. Specifically, we leverage graph neural networks (GNN) and attention mechanisms to efficiently learn the underlying relationships within the time series data. Moreover, we suggest employing hierarchical signal decompositions running over the graphs to capture multiple spatial dependencies. The effectiveness of our proposed model is evaluated across various real-world benchmark datasets designed for long-term forecasting tasks. The results consistently showcase the superiority of our model, achieving an average 23\% reduction in mean squared error (MSE) compared to existing models.
Osteoporosis Prediction from Hand and Wrist X-rays using Image Segmentation and Self-Supervised Learning
Nov 12, 2023Abstract:Osteoporosis is a widespread and chronic metabolic bone disease that often remains undiagnosed and untreated due to limited access to bone mineral density (BMD) tests like Dual-energy X-ray absorptiometry (DXA). In response to this challenge, current advancements are pivoting towards detecting osteoporosis by examining alternative indicators from peripheral bone areas, with the goal of increasing screening rates without added expenses or time. In this paper, we present a method to predict osteoporosis using hand and wrist X-ray images, which are both widely accessible and affordable, though their link to DXA-based data is not thoroughly explored. Initially, our method segments the ulnar, radius, and metacarpal bones using a foundational model for image segmentation. Then, we use a self-supervised learning approach to extract meaningful representations without the need for explicit labels, and move on to classify osteoporosis in a supervised manner. Our method is evaluated on a dataset with 192 individuals, cross-referencing their verified osteoporosis conditions against the standard DXA test. With a notable classification score (AUC=0.83), our model represents a pioneering effort in leveraging vision-based techniques for osteoporosis identification from the peripheral skeleton sites.
Towards Better Generalization with Flexible Representation of Multi-Module Graph Neural Networks
Sep 14, 2022


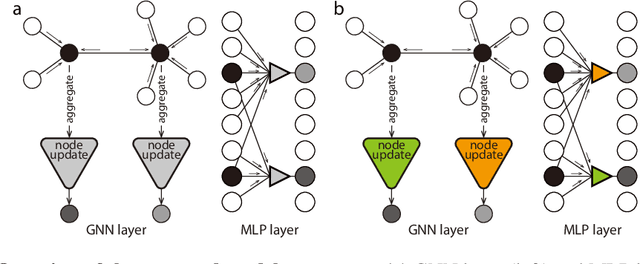
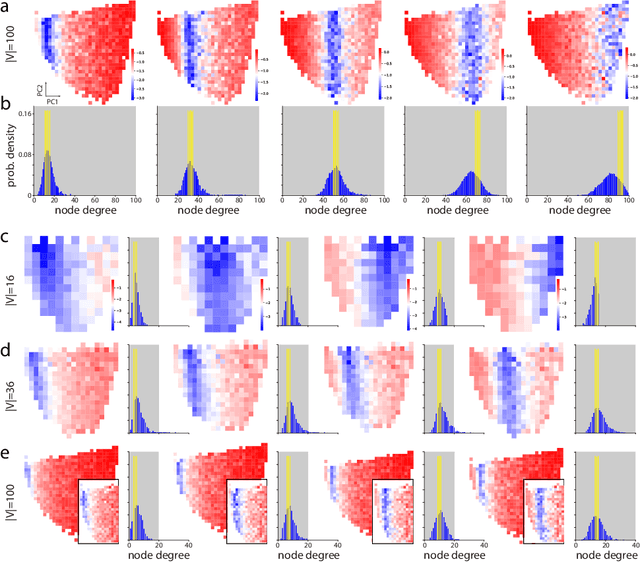
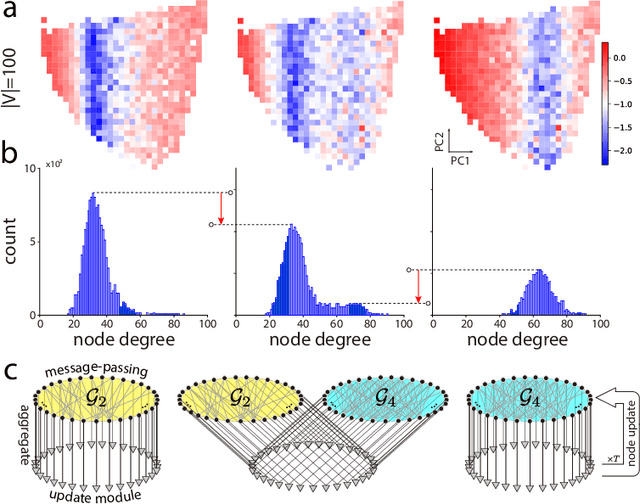
Abstract:Graph neural networks (GNNs) have become compelling models designed to perform learning and inference on graph-structured data, but little work has been done on understanding the fundamental limitations of GNNs to be scalable to larger graphs and generalized to out-of-distribution inputs. In this paper, we use a random graph generator that allows us to systematically investigate how the graph size and structural properties affect the predictive performance of GNNs. We present specific evidence that, among the many graph properties, the mean and modality of the node degree distribution are the key features that determine whether GNNs can generalize to unseen graphs. Accordingly, we propose flexible GNNs (Flex-GNNs), using multiple node update functions and the inner loop optimization as a generalization to the single type of canonical nonlinear transformation over aggregated inputs, allowing the network to adapt flexibly to new graphs. The Flex-GNN framework improves the generalization out of the training set on several inference tasks.
 Add to Chrome
 Add to Firefox
 Add to Edge