 Add to Chrome
 Add to Firefox
 Add to Edge
Scalable Vision-Guided Crop Yield Estimation
Nov 17, 2025Precise estimation and uncertainty quantification for average crop yields are critical for agricultural monitoring and decision making. Existing data collection methods, such as crop cuts in randomly sampled fields at harvest time, are relatively time-consuming. Thus, we propose an approach based on prediction-powered inference (PPI) to supplement these crop cuts with less time-consuming field photos. After training a computer vision model to predict the ground truth crop cut yields from the photos, we learn a ``control function" that recalibrates these predictions with the spatial coordinates of each field. This enables fields with photos but not crop cuts to be leveraged to improve the precision of zone-wide average yield estimates. Our control function is learned by training on a dataset of nearly 20,000 real crop cuts and photos of rice and maize fields in sub-Saharan Africa. To improve precision, we pool training observations across different zones within the same first-level subdivision of each country. Our final PPI-based point estimates of the average yield are provably asymptotically unbiased and cannot increase the asymptotic variance beyond that of the natural baseline estimator -- the sample average of the crop cuts -- as the number of fields grows. We also propose a novel bias-corrected and accelerated (BCa) bootstrap to construct accompanying confidence intervals. Even in zones with as few as 20 fields, the point estimates show significant empirical improvement over the baseline, increasing the effective sample size by as much as 73% for rice and by 12-23% for maize. The confidence intervals are accordingly shorter at minimal cost to empirical finite-sample coverage. This demonstrates the potential for relatively low-cost images to make area-based crop insurance more affordable and thus spur investment into sustainable agricultural practices.
Setting the duration of online A/B experiments
Aug 05, 2024In designing an online A/B experiment, it is crucial to select a sample size and duration that ensure the resulting confidence interval (CI) for the treatment effect is the right width to detect an effect of meaningful magnitude with sufficient statistical power without wasting resources. While the relationship between sample size and CI width is well understood, the effect of experiment duration on CI width remains less clear. This paper provides an analytical formula for the width of a CI based on a ratio treatment effect estimator as a function of both sample size (N) and duration (T). The formula is derived from a mixed effects model with two variance components. One component, referred to as the temporal variance, persists over time for experiments where the same users are kept in the same experiment arm across different days. The remaining error variance component, by contrast, decays to zero as T gets large. The formula we derive introduces a key parameter that we call the user-specific temporal correlation (UTC), which quantifies the relative sizes of the two variance components and can be estimated from historical experiments. Higher UTC indicates a slower decay in CI width over time. On the other hand, when the UTC is 0 -- as for experiments where users shuffle in and out of the experiment across days -- the CI width decays at the standard parametric 1/T rate. We also study how access to pre-period data for the users in the experiment affects the CI width decay. We show our formula closely explains CI widths on real A/B experiments at YouTube.
RbX: Region-based explanations of prediction models
Oct 17, 2022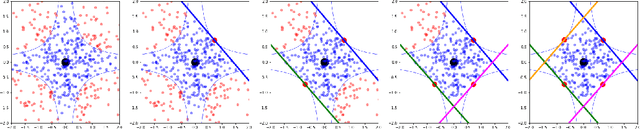
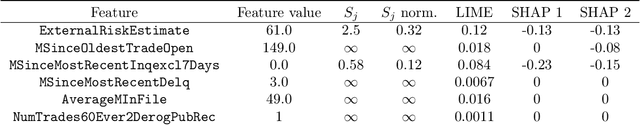
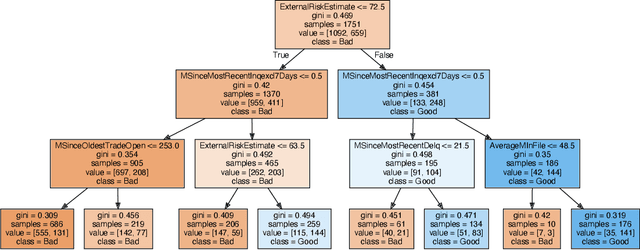
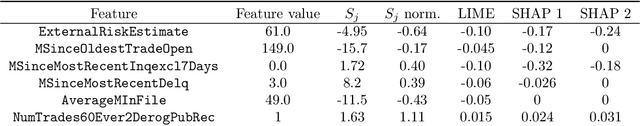
We introduce region-based explanations (RbX), a novel, model-agnostic method to generate local explanations of scalar outputs from a black-box prediction model using only query access. RbX is based on a greedy algorithm for building a convex polytope that approximates a region of feature space where model predictions are close to the prediction at some target point. This region is fully specified by the user on the scale of the predictions, rather than on the scale of the features. The geometry of this polytope - specifically the change in each coordinate necessary to escape the polytope - quantifies the local sensitivity of the predictions to each of the features. These "escape distances" can then be standardized to rank the features by local importance. RbX is guaranteed to satisfy a "sparsity axiom," which requires that features which do not enter into the prediction model are assigned zero importance. At the same time, real data examples and synthetic experiments show how RbX can more readily detect all locally relevant features than existing methods.